K-Patents SeedMaster 2 User Manual
Page 94
12 APPENDECES
94
94
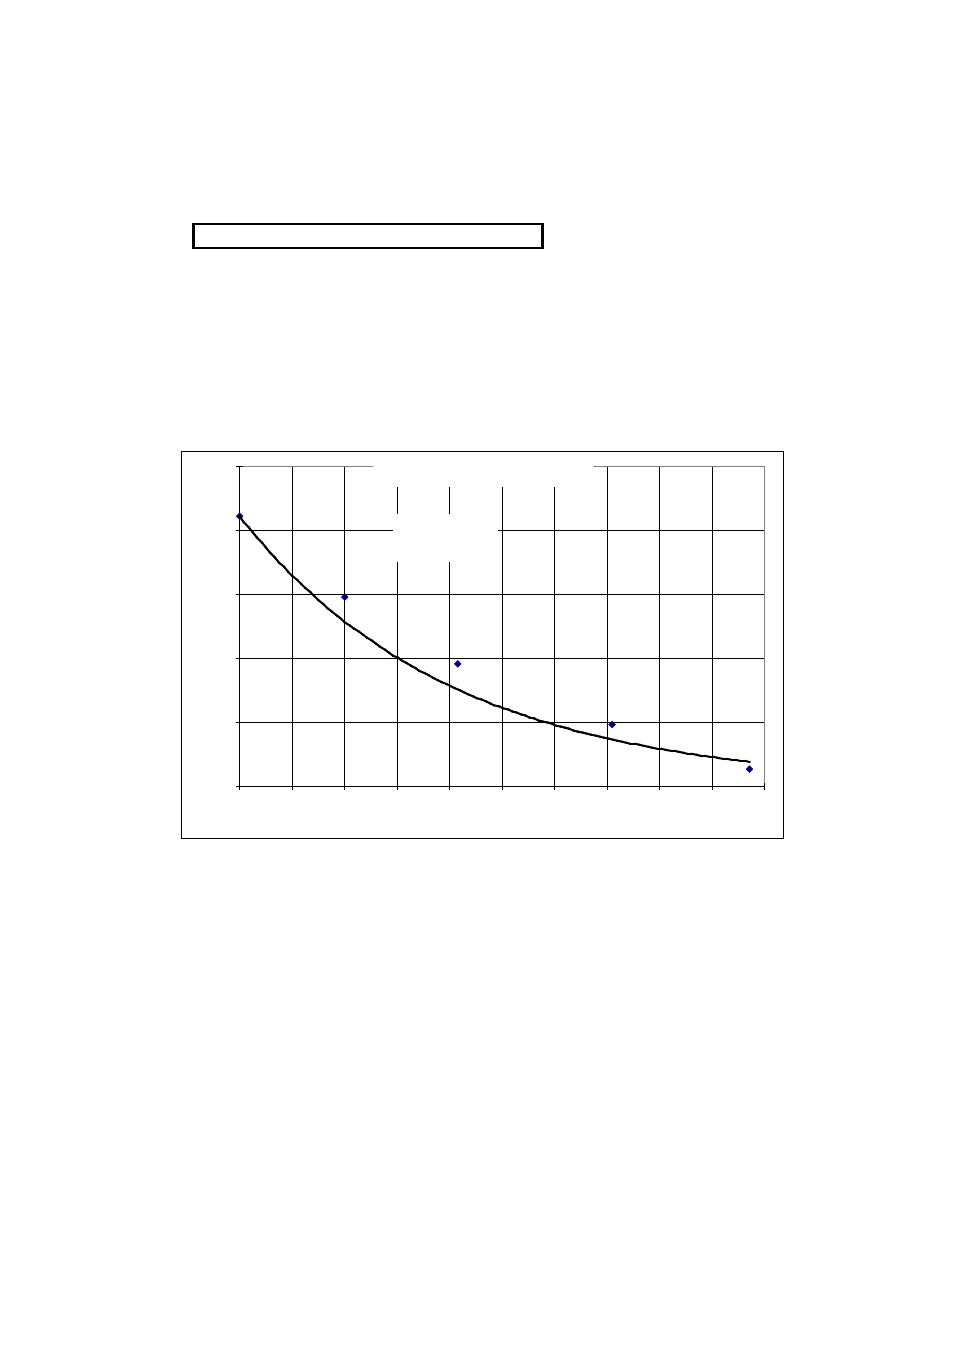
Let us continue with the part of the chart valid for lower nonsugar to water ratios (sample numbers 4, 5, 6, 7).
Calculate
SAT.COEFF - m.(NS/W)** - b
data for these samples and do again a least squares fit in Excel for these data using 1-b as Y axis intercept :
(NS/W)**
SAT.COEFF.
S.C.-m.(N/W)**-b
1
1,824
1,150
2
1,589
1,085
3
1,182
1,022
4
0,971
0,992
0,0150
5
0,710
0,977
0,0498
6
0,416
0,967
0,0969
7
0,201
0,977
0,1489
8
0,000
1,000
0,2110
Fig. A.4
Now we have completed the task by finding from the data fit :
c = - 2,47
The complete set of parameters is :
m = 0,194
b = 0,789
c = - 2,47
Fig. A5. shows the sample data on the saturation coefficient and the value of the saturation function
using the above set of quality parameters.
SATURATION COEFFICIENT - m.(NS/W)** - b
y = 0,211e
-2,4677x
R
2
= 0,9423
0,0000
0,0500
0,1000
0,1500
0,2000
0,2500
0,000
0,100
0,200
0,300
0,400
0,500
0,600
0,700
0,800
0,900
1,000
SAMPLE NONSUGAR TO WATER RATIOS (NS/W)**