K-Patents SeedMaster 2 User Manual
Page 93
12 APPENDECES
93
93
1
1,824
1,149
2
1,589
1,083
3
1,182
1,021
4
0,971
0,991
5
0,710
0,975
6
0,416
0,965
7
0,201
0,976
8
0
1,000
SAT.COEFF.
0,96
0,98
1
1,02
1,04
1,06
1,08
1,1
1,12
1,14
1,16
0
0,2
0,4
0,6
0,8
1
1,2
1,4
1,6
1,8
2
SAMPLE NONSUGAR TO WATER RATIOS (NS/W)**
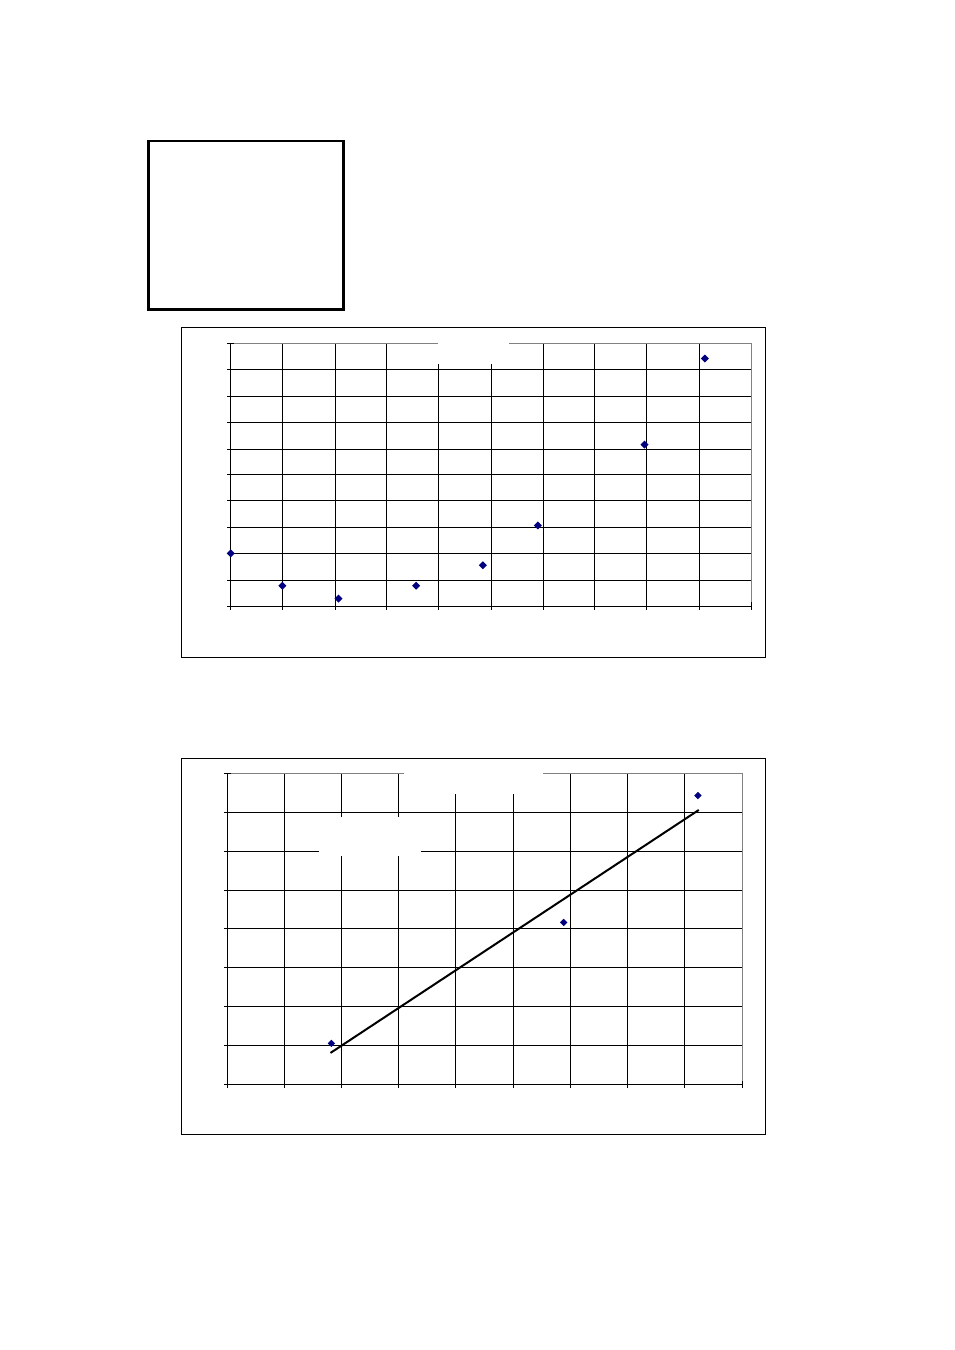
Fig. A.2
It can be seen (Fig. A2.) that the linear part of the chart starts at about (NS/W)** = 1.2. This belongs to sample
numbers 1, 2 and 3. Separate these data on another chart and do the linear least square calculation in Excel
(Fig. A3.) :
SATURATION COEFFICIENT
y = 0,1936x + 0,788
R
2
= 0,9717
1
1,02
1,04
1,06
1,08
1,1
1,12
1,14
1,16
1
1,1
1,2
1,3
1,4
1,5
1,6
1,7
1,8
1,9
SAMPLE NONSUGAR TO WATER RATIOS (NS/W)**
Fig. A.3
Now we already have the “m” and “b” parameters :
m = 0.194 b = 0.788