1 graph types, Graph types – CIRCUTOR PowerStudio Series User Manual
Page 98
PowerStudio
98 User Manual
Period selection menu
1.3.6.1 Graph types
So far we have seen standard graph types, i.e. graphs comprising a number of areas, where
each zone has an X-axis, which is a time interval and a Y-axis for variable values. However, there are
certain types of graphs that have distinct characteristics.
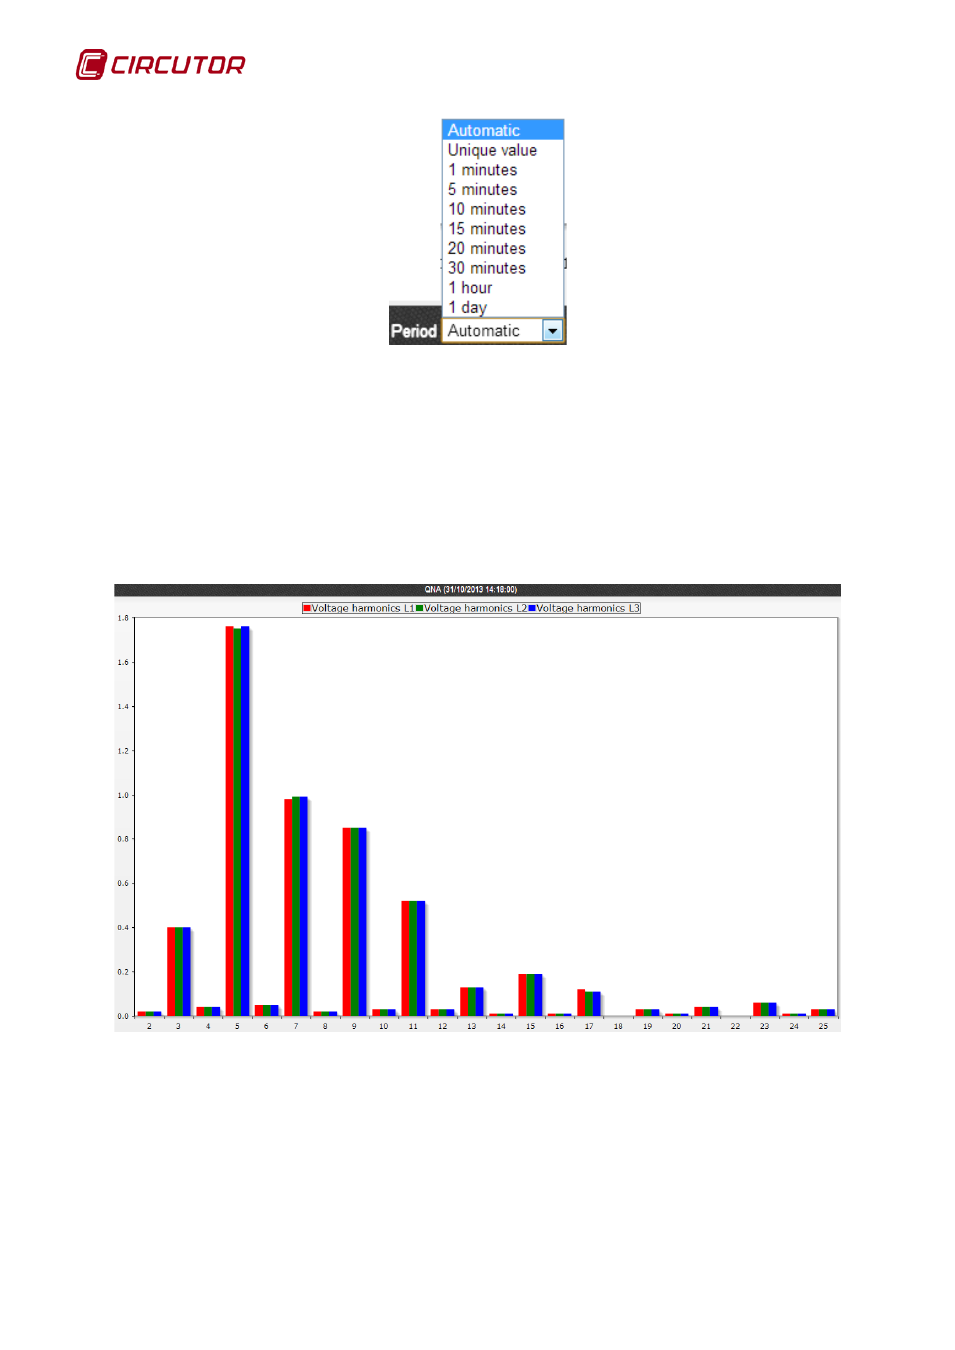
A harmonics graph would be a special graph. This chart is provided by equipment that
calculates harmonics variables, whether voltage or current. This type of graph may be found on QNA
equipment, for example, among others, and can show harmonic distortion for voltage as well as
current in each phase.
Harmonics graph
This type of graph has some special features:
• Subtitle: In the caption under the graph title, the date of the harmonic distortion being
displayed is indicated.
• X-axis: The X- axis does not represent time, but rather the harmonic number. It therefore
lacks units.
• Toolbar: The toolbar contains only 3 buttons to display other records, earlier records may be
displayed, or later ones, or those closest to a date specified by the user ("Go to" option).