9 displaying logged events, Displaying logged events – CIRCUTOR PowerStudio Series User Manual
Page 103
PowerStudio
User Manual 103
1.3.9 Displaying logged events
Another important client tool is the ability to create tables showing information about past
events. Access this view using directly the “Events” button on the toolbar. A table of events from a
SCADA screen can be created wherein the event display control can be added
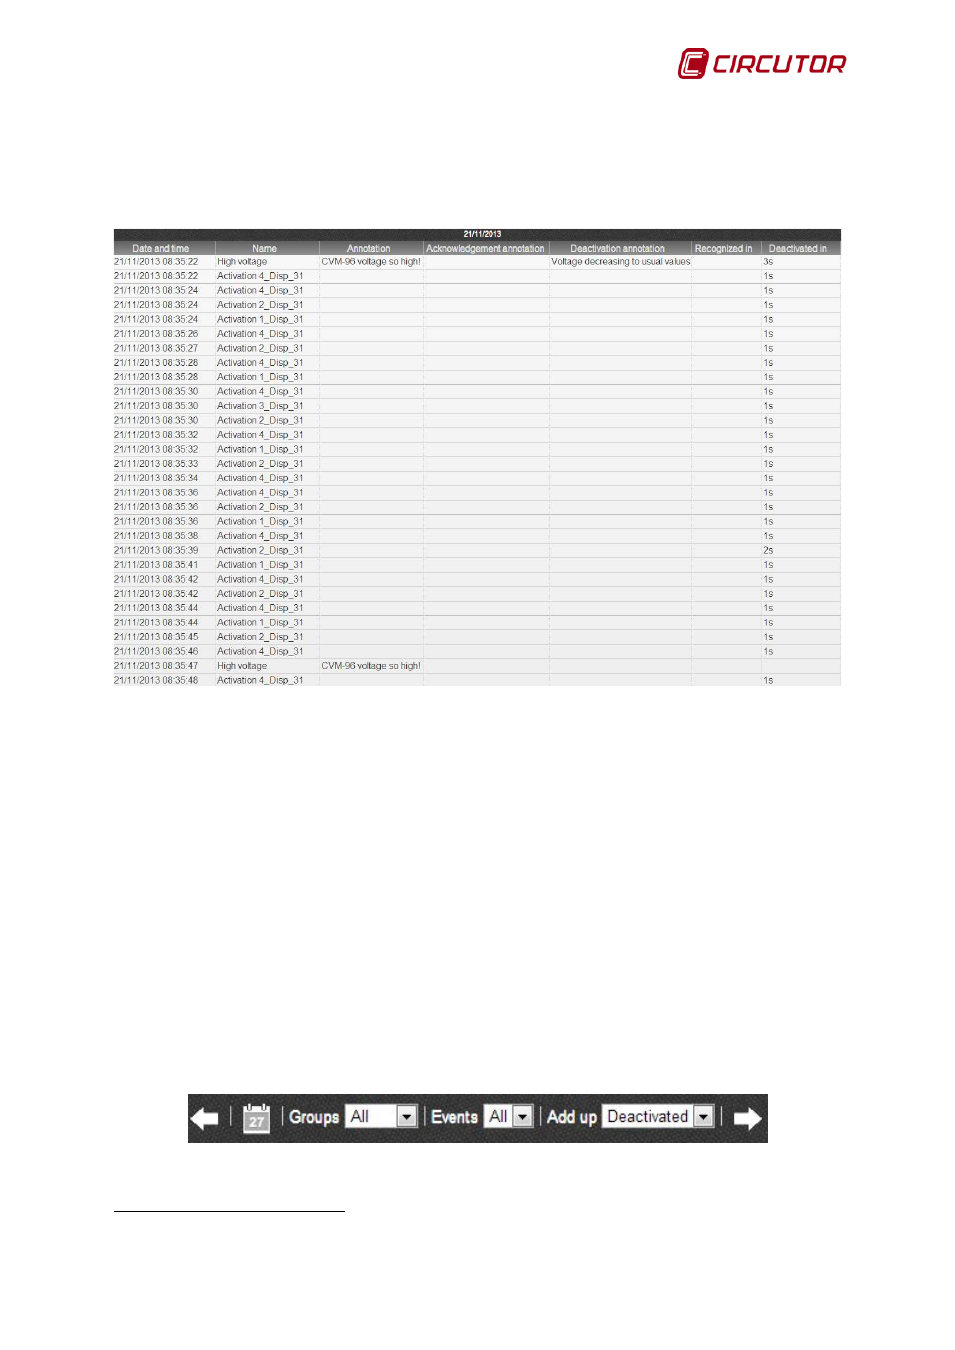
Logged events table
This table has two different viewing modes, the normal mode and the total mode. The normal
mode (above) table consists of five columns.
• Date and time: Indicates the date and time at which the incident occurred.
• Name: Name of event that occurred.
• Annotation: Description of the event when it is activated, which can include data related to the
event or to the execution environment when the event is activated.
• Acknowledgement annotation: Description of the event when it is acknowledged.
• Deactivation annotation: Description of the event when it is deactivated.
• Recognized in: Time taken for the event to be acknowledged, whether or not it is finally
acknowledged. Floating the cursor over a cell will bring up a tooltip with the date on which the
event was recognized.
• Deactivated on: Time the event took to end, if it actually ended. Floating the cursor over a cell
will bring up a tooltip with the date on which the event ended, if the event existed.
As a standard table, the active events table shows a time interval. These intervals may be
navigated or modified using the toolbar and the first four buttons on the left, as was discussed in the
section on graphs. However, the toolbar provides some extra options that permit a certain degree of
configuration for this type of table.
Logged events table toolbar
9
Only in SCADA and Deluxe versions