9 making graphs, Making graphs – CIRCUTOR PowerStudio Series User Manual
Page 35
PowerStudio
User Manual 35
1.2.9 Making graphs
One of the most powerful tools of the client is the possibility of making graphs of the device
variables (trends). This view can be accessed using the "Views" menu option, then "Studio" and finally
“Graph” or directly from the “Graph” button on the toolbar. Graphs can be made from a predefined
SCADA screen where the graph control has been added or, as mentioned in the previous chapter,
from the buttons defined for this purpose in some types of device monitoring views (e.g. a QNA
monitoring view).
Typically, to make a graph the variables of the device that will be part of it need to be chosen.
Thus, when accessing the “Graph option” from the main menu or from the toolbar, first a dialogue will
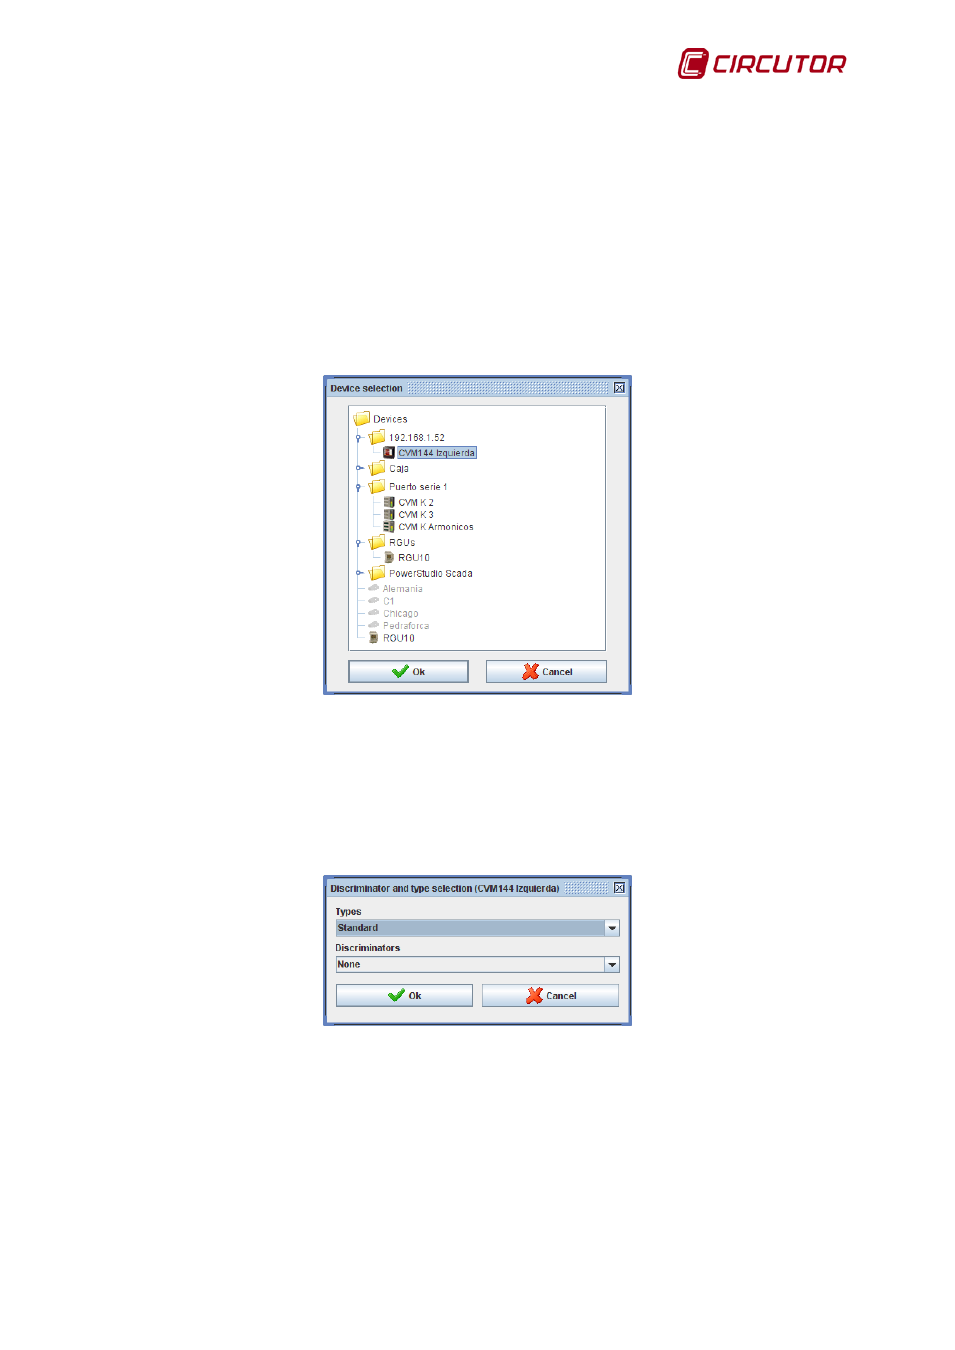
appear which allows selection of the device from which the variables will be chosen, and that will be
part of the graph.
Device selection screen
At first only variables from the same device may be chosen to create the graph, later variables
from other devices may be added (this will be explained further on). If the “Graph” option is selected
while in device monitoring the client application will understand that a graph of what is being displayed
is desired and will skip back to the previous screen.
Depending on the device chosen, a screen will then appear to select the type of graph and the
filter to be applied.
Graph and filter type selection screen
Note only certain types of graphs can be filtered, usually the standard type, if the graph type
chosen cannot be filtered the “filter” option will be disabled. If a default filter has been defined for the
equipment, it may still be modified or another one chosen, or it may be disabled. It is also possible that
the equipment does not allow more than one type of graph, and that there are no filters defined, or they
are not applicable to this type of graph; in which case this screen will not appear and will pass directly
to selection of variables for the device in question.
After selecting the figure type and filter, the variables selection screen will appear.