CIRCUTOR PowerStudio Series User Manual
Page 60
PowerStudio
60 User Manual
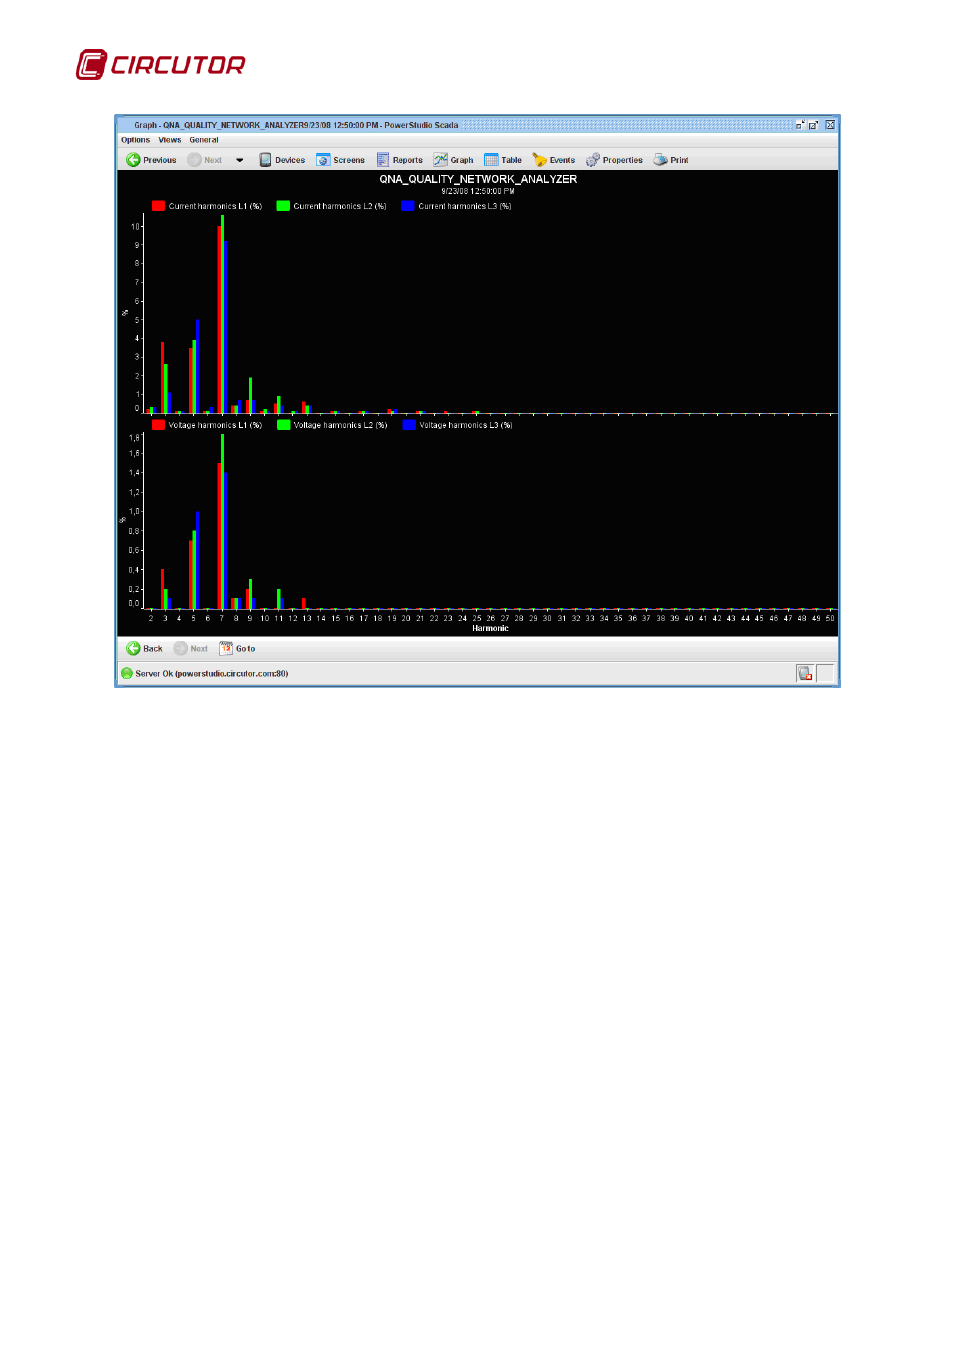
Harmonics graph
This type of graph has some special features:
• Subtitle: In the caption under the graph title, the date of the harmonic distortion being
displayed is indicated.
• X-axis: The X- axis does not represent time, but rather the harmonic number. It therefore
lacks units.
• Toolbar: The toolbar contains only 3 buttons to display other records, earlier records may be
displayed, or later ones, or those closest to a date specified by the user ("Go to" option).
• Properties: The configurable properties of this type of graph are the same as with a standard
graph, the only difference being that only variables from equipment containing this type of
variable are available.
• Representation using bars: Sets default representation to bars, as a special feature, but
these can be reconfigured later.
Another special feature graph is the waveform graph, generated by QNA equipment, which can
provide a screenshot of the voltage waveform as well as the current in each one of the phases.
The characteristics of this graph are very similar to the harmonics graph. The only differences
are that the X-axis units are milliseconds and that the representation is in lines by default. Only
waveform variables may be added to this type of graph.