CIRCUTOR PowerStudio Series User Manual
Page 37
PowerStudio
User Manual 37
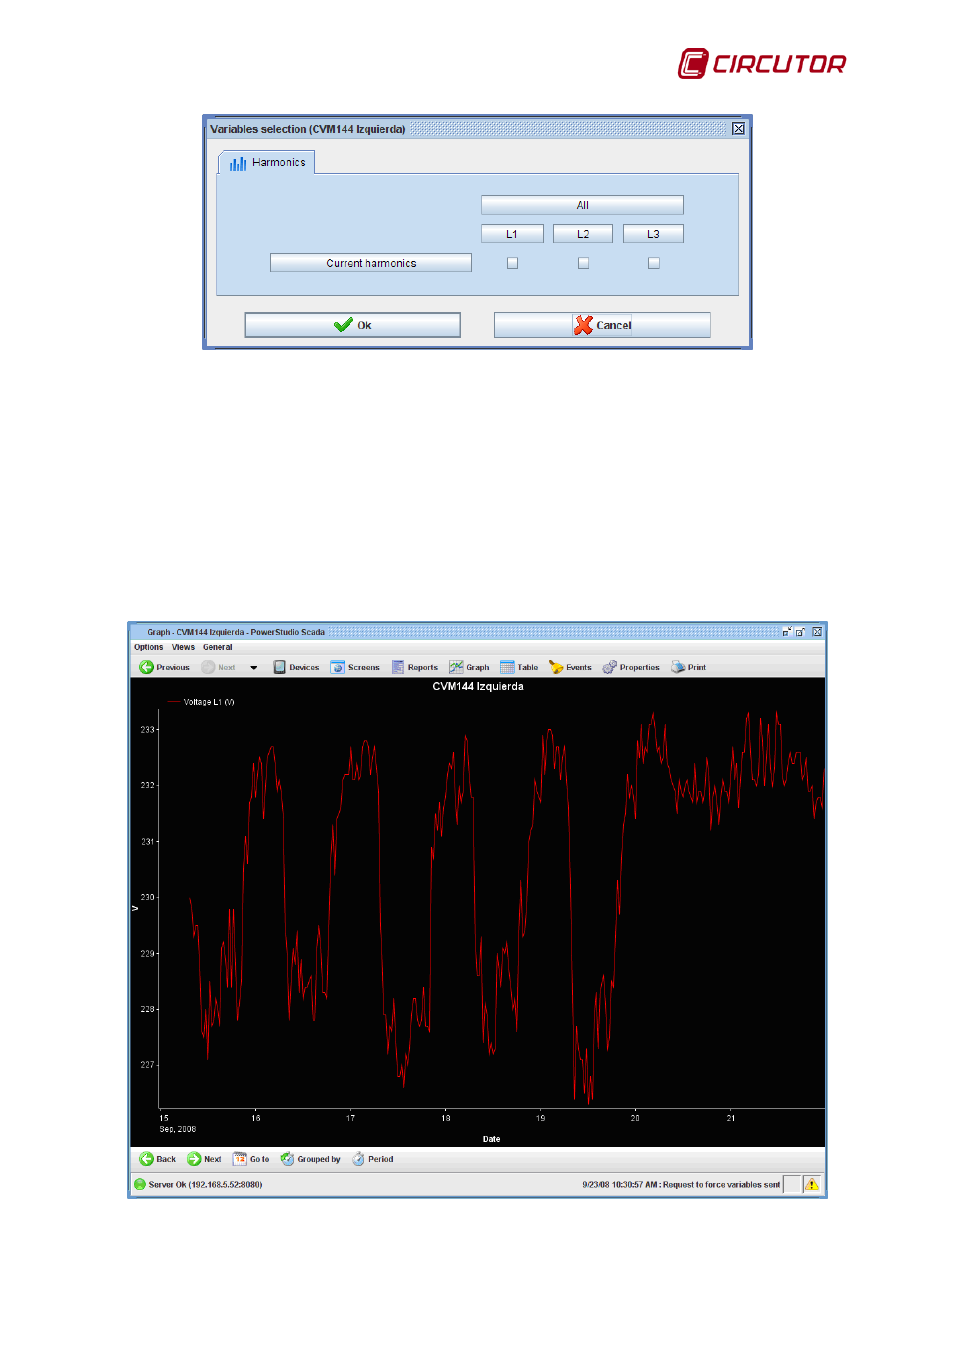
Harmonic variables selection screen
Once variable display selection has been made, the graph with the variables in question will
appear.
The system automatically chooses the representation period and the grouping of data, which
can obviously be changed later. Later we will explain what the two concepts mean and how they can
be changed. It should be noted that the grouping chosen is a week and the period is typically 30
minutes. If the graph we are accessing comes from graph control on a SCADA screen, both the
grouping and the period are determined in the control and need not be predetermined by default.
However, as always, both properties can be modified in the graph view later. Similarly certain types of
representations are chosen by default (line, bars, etc.), as well as a few colors and a distribution of the
variables in axes and areas depending on the variables represented. All these characteristics can be
modified later at will. A description of what they mean and how they are modified will be explained later.
Graph of a standard variable without filtration.