CIRCUTOR PowerStudio Series User Manual
Page 97
PowerStudio
User Manual 97
Tooltip mode
The graphs always have a toolbar at the bottom that allows a series of actions related to the
data to be shown.
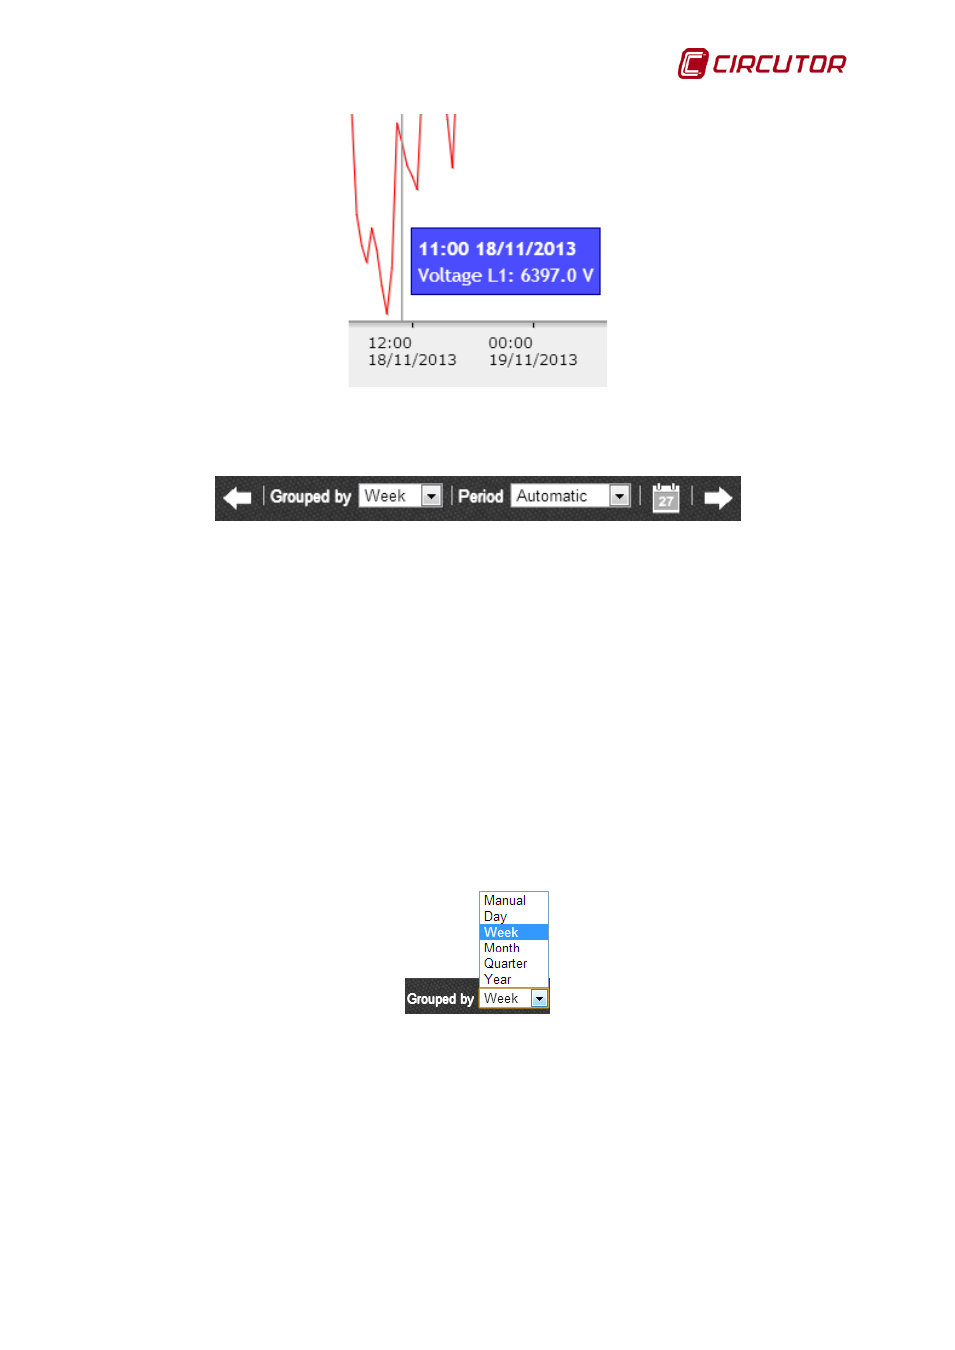
Toolbar of a typical graph
The typical options available in the toolbar are:
• Back: Displays the previous interval of data. Typically, the range of previous data is a function
of data grouping and, if grouped by days, upon going to the previous interval the previous day's
data is displayed. There are types of graphs where grouping does not make sense, because
they are displaying values of a specific date (for example in QNA harmonics graphs), clicking
on this option in this case displays the next date immediately following that contains data.
• Next: Displays the next interval of data. Typically, the interval of data following this is based on
the data grouping and, if grouped by weeks, upon going to the following interval data from the
following week is displayed. There are types of graphs where grouping does not make sense,
because they are displaying values of a specific date (for example in QNA harmonics graphs),
clicking on this option in this case displays the next date immediately following that contains
data.
• Go to: Displays data within a user-defined time interval.
• Grouped by: Allows data grouping to be changed. Grouping is just the data interval desired to
be displayed. Typically there are six predefined groupings: manual, day, week, month, quarter
and year.
"Grouped by” Selection Menu
• Period: Enables desired date period to be specified. Each device can be configured to store
data every so often, typically in periods of 10 or 15 minutes. Use this option view data in a
different period, which must always be higher than that defined by the device. Note that this
does not change the configuration of the device, which will continue using the period
configured by the engine / editor, but will group the data, to a certain extent, to simulate the
fact that the device was programd for that period. Note that there is an "Automatic" option,
which directs the program to choose the period that best suits the selected grouping.