CIRCUTOR PowerStudio Series User Manual
Page 96
PowerStudio
96 User Manual
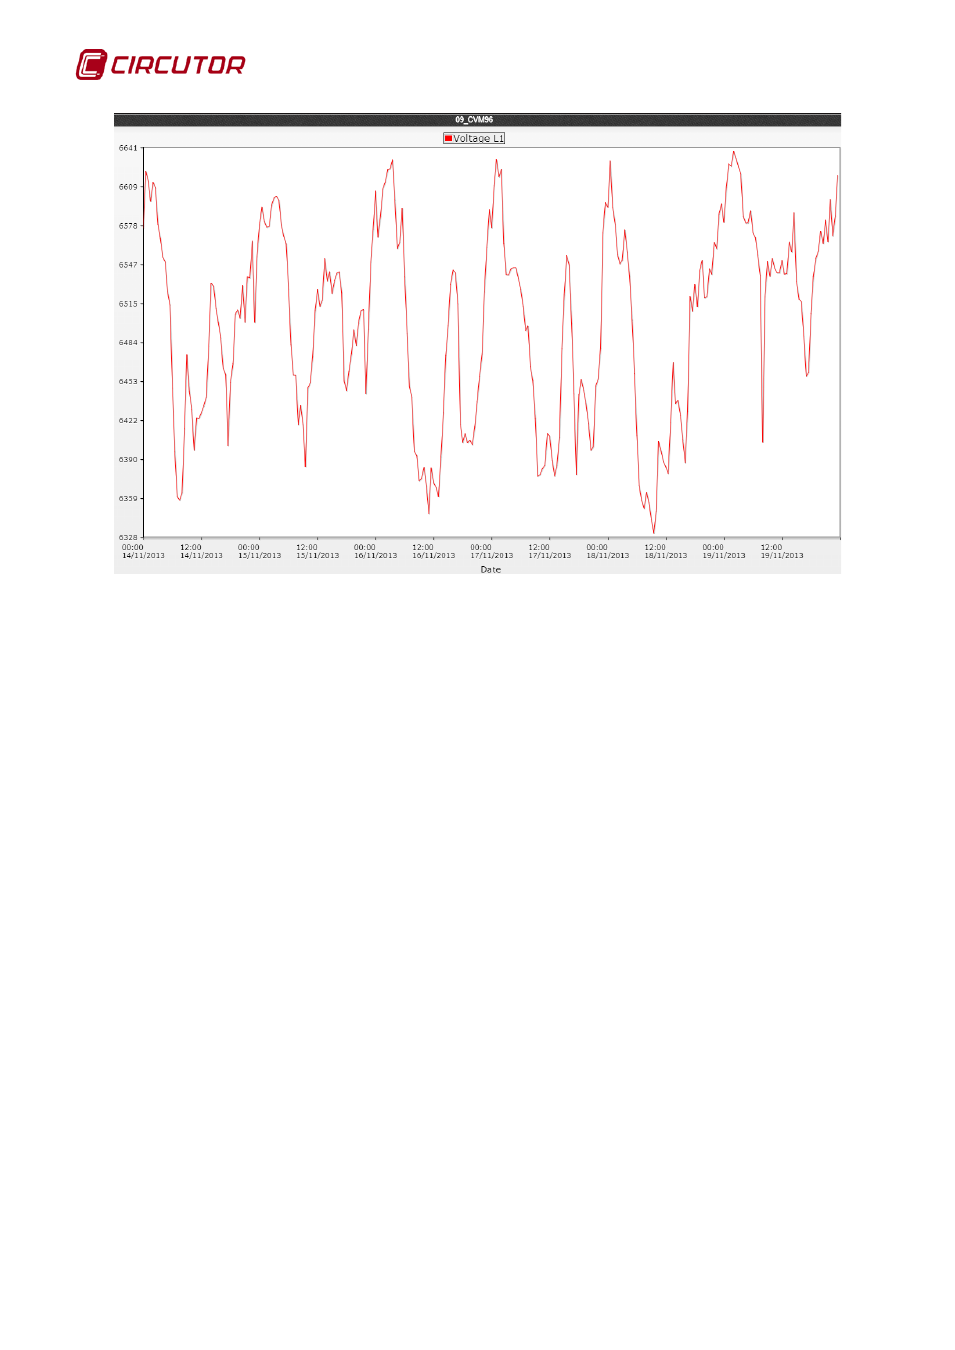
Graph of a standard variable without filtration
As can be seen a typical graph consists of a series of common characteristics:
• Title: Situated on the upper area, this is a text describing the graph being viewed. Typically,
the names of devices forming part of the displayed variables are shown. They may contain
several lines of text, so that they can be represented as subtitles.
• Representation areas: These are areas where data may be viewed. Typically, a graph
consists of one area, as in the previous example, but there may be several, each under the
next. Each area contains some common characteristics:
o
Key: Provides general information about the variables that are represented in the
area. This information is often the color of the variable, the type of representation, the
title of the graph, and in some cases, a value indicating some feature of the variable
for the current representation (for example it is typical to see on energy variables the
accumulated value of all the visible values).
o
Y-Axis: Provides information on the units of the variables that are represented in this
axis and the range of values that are being displayed. At first the range is calculated
so that they fit all the values of all the variables included in this axis. Typically, an area
has a y-axis, although this may be modified by the user as will be explained later.
o
X-axis: Typically, this is the time axis and is located at the bottom of the
representation area. Here the time interval being represented may be seen. Usually
predefined time intervals are represented (day, month, etc.). But the user can choose
the most suitable as can be seen later. Similarly, there are types of graphs where this
axis does not represent time, in this case the units represented and the range of
values contained will be indicated.
o
Drawing area: Contains the actual figure representing the variables of the area in
question. There is a drawing area for each area of representation.
In addition, the graphic shows the tooltip function, which will display the values of the variables
closest to the cursor from the X-axis. These values are updated instantly as the cursor is moved.