10 making tables, Making tables – CIRCUTOR PowerStudio Series User Manual
Page 64
PowerStudio
64 User Manual
1.2.10 Making tables
Another important client tool is the ability to make variable value tables for a piece of
equipment. Access this view using the "Views" menu option, then "Studio" and finally “Table” or directly
from the “Table” button in the toolbar. Tables may be created from a predefined SCADA screen, where
a control table has been added, or from buttons defined for this purpose in the monitoring view of a
device (for example, a QNA monitoring view).
Typically, to make a table it is necessary to choose what variables from which devices will be
part of it. The selection of these variables is done in the same manner as for generating a graph.
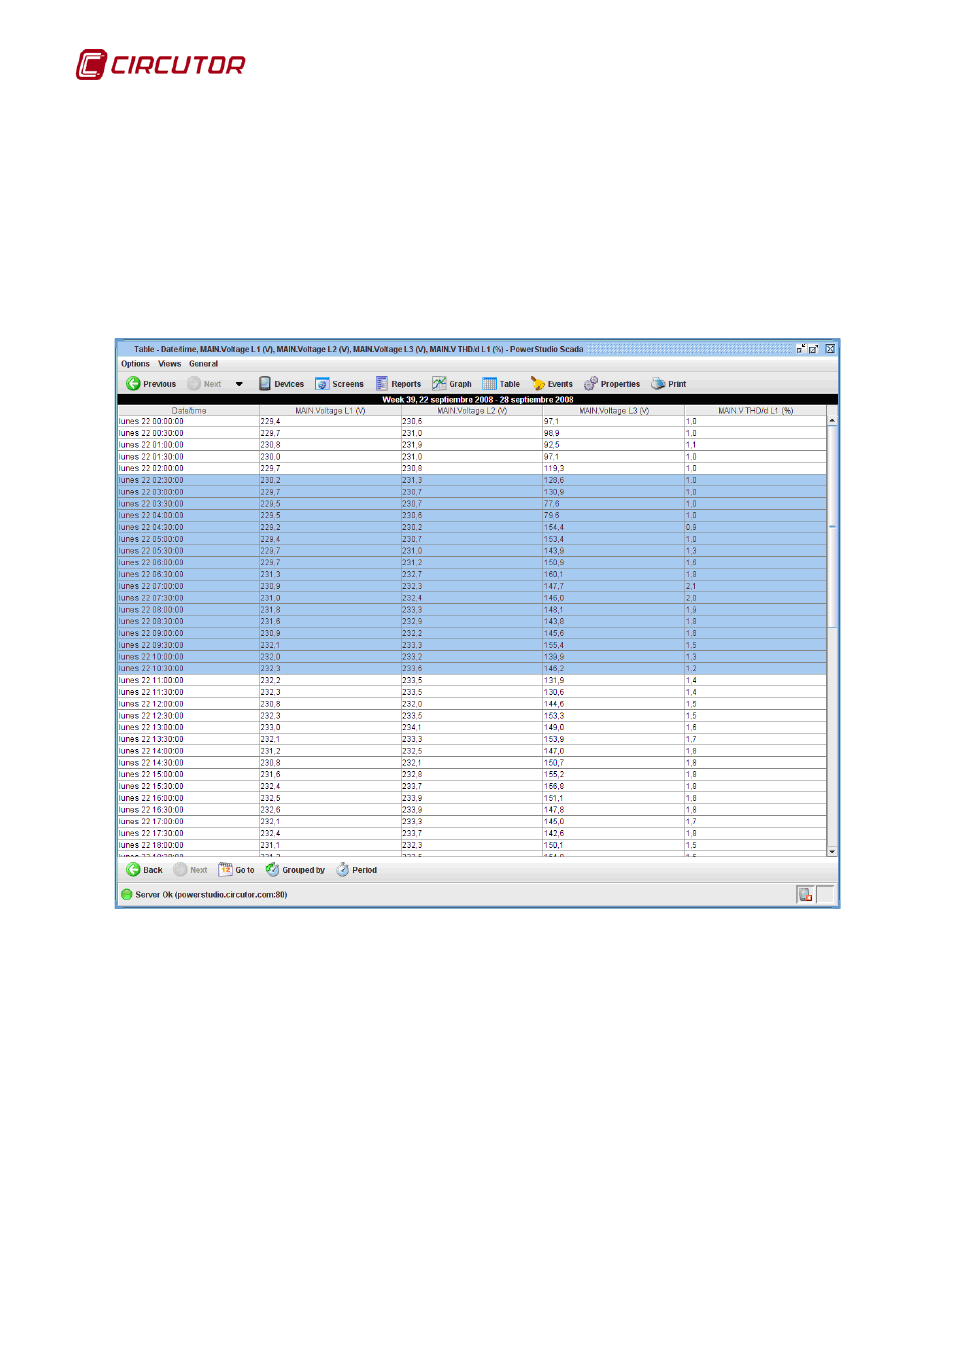
Selection produces a table like this:
Value table
Note that the typical value table consists of three parts:
• Title: This usually indicates what data period is displayed, although in special tables it may
contain other information.
• Body: This contains a series of columns with the values each variable has in each register.
Each column is a variable and contains a header with the same title.
• Toolbar: As in the graph, the grouping and the displayed data period can be configured.
There is a direct equivalence between the tables and graphs, in other words, the same type of
graph and table show the same values but in different formats and, obviously, with different
configuration capacities.
This feature is used by the PowerStudio client to deduce what graph or table to create when on
a graph or table display. That is, if a chart is displayed and client table button is clicked, PowerStudio
will deduce that a table of the variables represented in the graph is desired, and will immediately