CIRCUTOR PowerStudio Series User Manual
Page 66
PowerStudio
66 User Manual
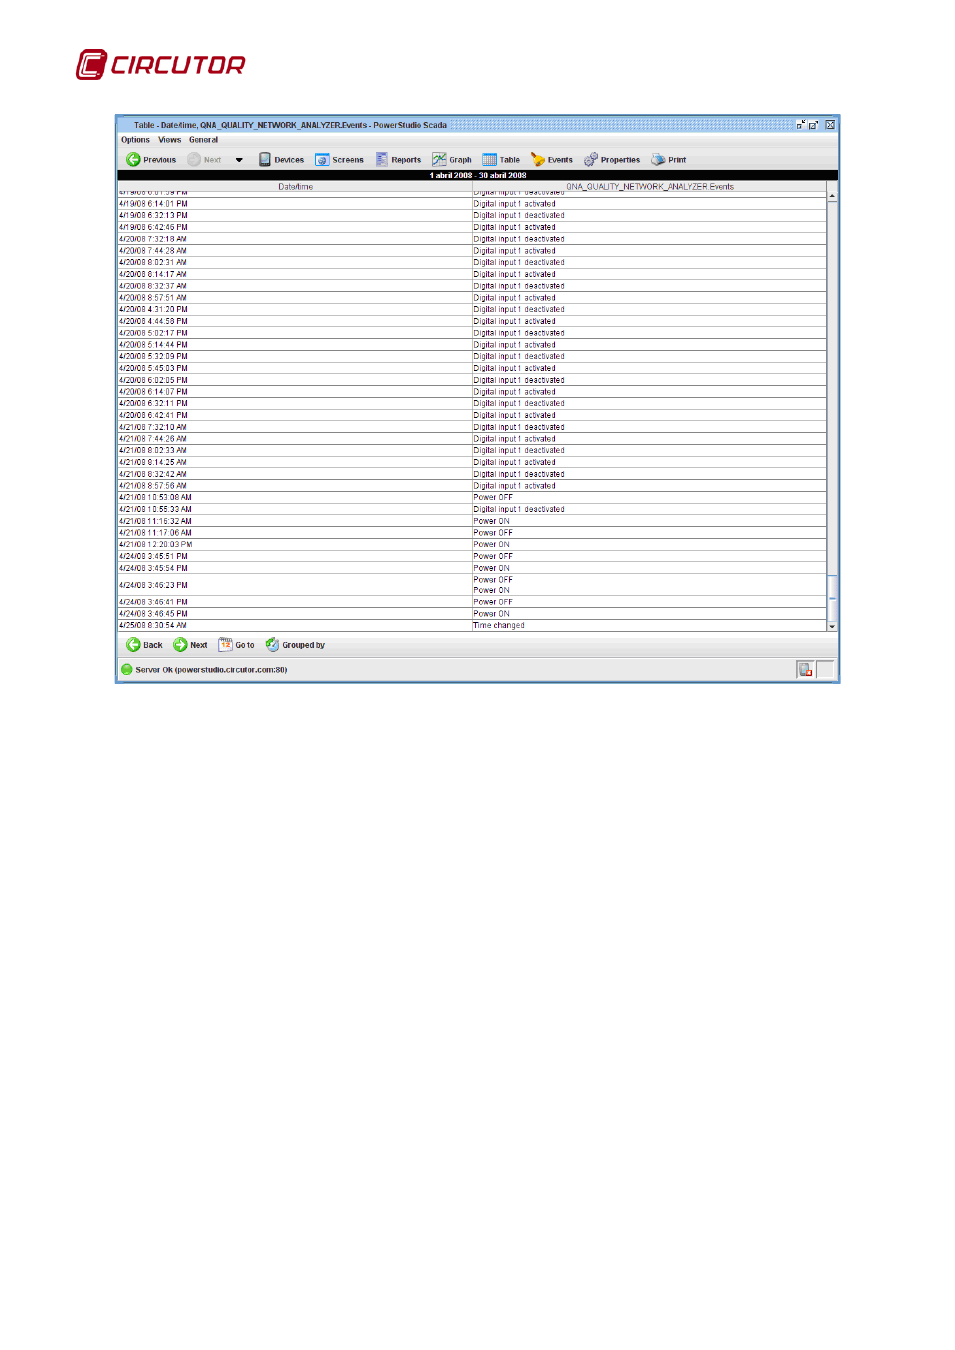
QNA events timetable
The table has two columns: the first is the date and time when the incident occurred, and the
second is its description.
As you can see, this table does not allow the properties of the screen to be changed, nor the
variable period (which would not, on the other hand, make any sense). However it is possible to print it
in same way as other tables.
Special graphs have their equivalent table, and therefore we have table equivalents for
harmonics graphs, waveforms, logged events, duration of events and effective voltage semi-cycle
events.
The logged events table is peculiar in that for every event a great deal of information may be
displayed:
• Event Type: An icon at the beginning of the report will indicate whether it is a gap, an
interruption or an overvoltage.
• Value of the event: Indicates the most representative event value. In the case of an
overvoltage this value is the highest registered by the event, in other cases it is the minimum
value reached. It is expressed as a percentage of the nominal voltage.
• Duration: The first value in brackets indicates the duration of the event.
• Average voltage: Indicates average voltage of the event, expressed as a percentage of the
nominal voltage.
• Previous Voltage: Indicates the voltage present at the beginning of the event, expressed as a
percentage of the voltage.