7 printing a graph, 8 export graph, 9 graph types – CIRCUTOR PowerStudio Series User Manual
Page 59: Printing a graph, Export graph, Graph types
PowerStudio
User Manual 59
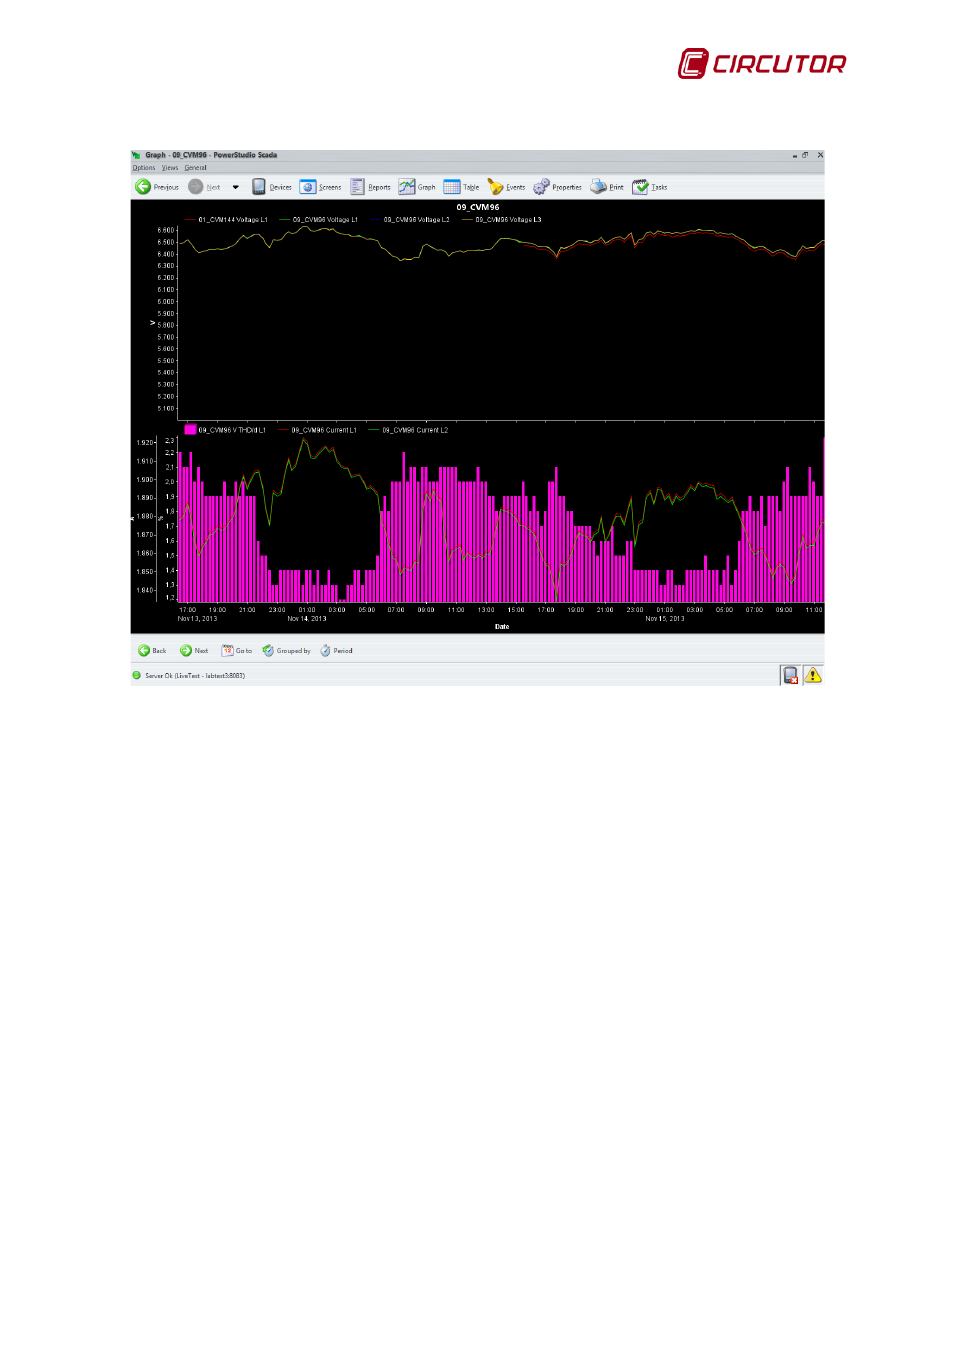
The resulting figure would be as follows:
Graph with variables from multiple devices
1.2.9.7 Printing a graph
The user can print the current graph page at any time using “print” in the “Options” menu of the
main menu or the "Print" button of the upper toolbar. Note that this option, unlike that in the SCADA
screens, is enabled for graphs.
1.2.9.8 Export graph
The user may at any time export the graph being viewed in a PNG format. This option should
be accessed through “Export" in the “Options" menu of the main menu. Note that this option, unlike
that in the SCADA screens, is enabled for graphs.
Note that graphs are exported with a white background to facilitate their inclusion in reports,
studies, etc.
1.2.9.9 Graph types
So far we have seen standard graph types, i.e. graphs comprising a number of areas, where
each zone has an X-axis, which is a time interval and a Y-axis for variable values. However, there are
certain types of graphs that have distinct characteristics.
A harmonics graph would be a special graph. This chart is provided by equipment that
calculates harmonics variables, whether voltage or current. This type of graph may be found on QNA
equipment, for example, among others, and can show harmonic distortion for voltage as well as
current in each phase.