Overlay (graphing) multiple files – Haltech IQ3 Data Logger Dash User Manual
Page 69
IQ3 Data Logger Dash Installation Manual
69
Overlay (Graphing) Multiple Files
At this point, we have reviewed the basics of how to open and graph a single file. We will now
review how to open, graph and compare two files. Multiple files can be viewed simultaneously
using the DataLink II software.
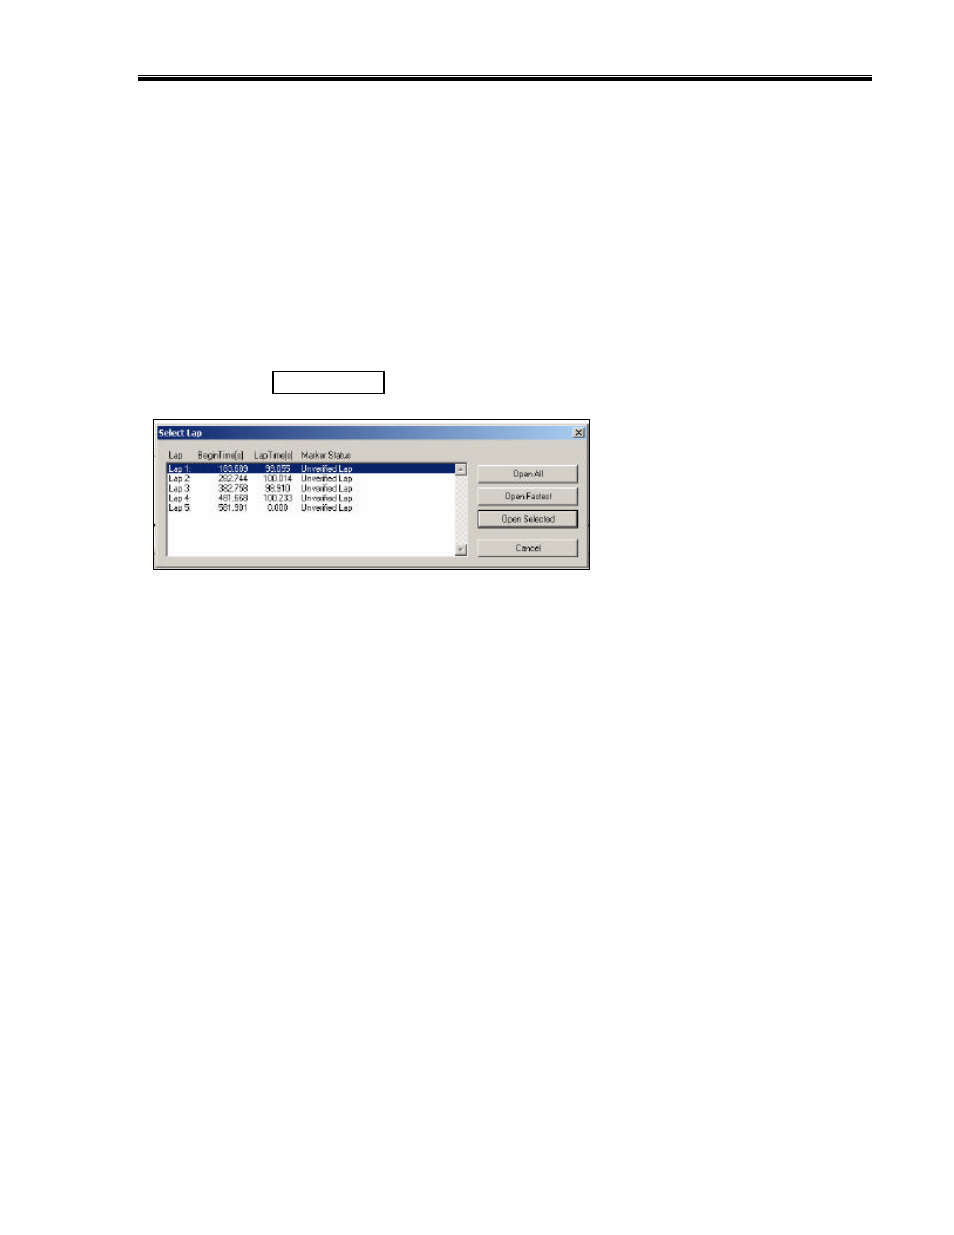
To open another lap for review:
1. Place the mouse cursor over the current Runfile tab and right click.
2. Select the desired lap.
3. Left click the Open Selected button.
When a new lap is opened, no additional graphed data will appear in the Main Graph area. The
user must “activate” the new lap. To do so:
1. Place the mouse cursor over the just opened Lapfile tab and left click.
2. Data can now be graphed.
In essence, that is all that is required to overlay graphed data. To graph data from multiple
laps, simply continue opening Lapfiles, and graphing data. To graph data from multiple test
runs, open the desire Runfile, open the desired Lapfile and graph the data. The only limit to the
number of files that can be opened and graphed depends on the memory capabilities of the
user’s PC.
Remember, to change the graph color of a particular channel, keep the mouse cursor over the
Channel Button and continue to left click, until a desired color is obtained.