Svc example fvc example (flow/vol curve) – Welch Allyn CP 200 Spirometry Option - User Manual User Manual
Page 46
42
Chapter 4 Performing Spirometry Tests
Welch Allyn CP 200 Spirometry Option
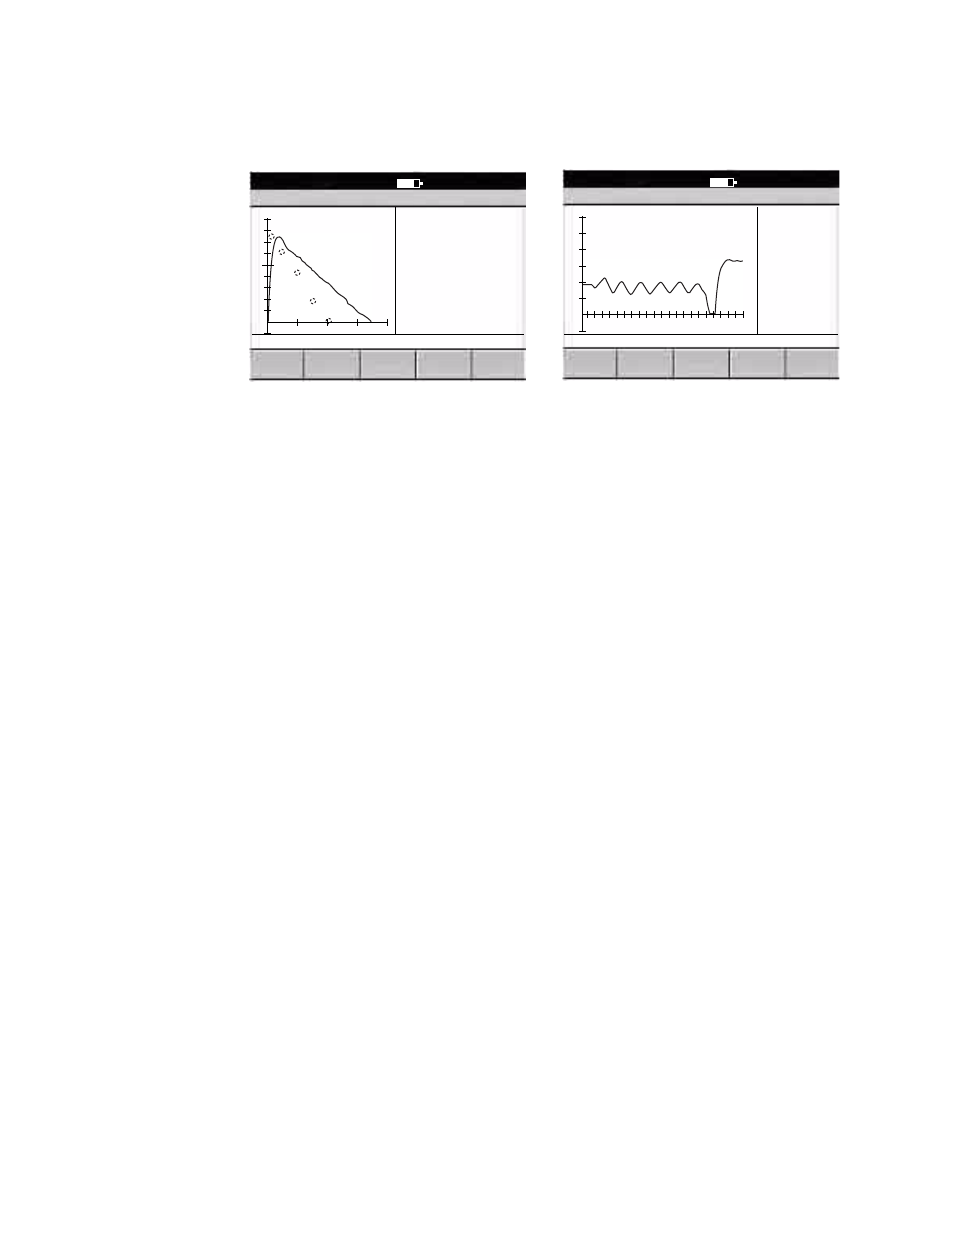
Figure 29. “Effort Complete” Screen
For FVC efforts, the “% predicted” values display in color as follows:
Red:
% predicted values are below LLN.
Black: % predicted values are normal.
Green:
% predicted values are at least 100%.
11. Review the data.
For FVC tests, if desired, press Curve to alternate between curve types.
Decide whether to accept the effort. For help deciding, see the Spirometry Effort
Acceptability & Reproducibility poster.
12. Press the desired softkey.
•
Accept Effort
Saves the effort. See
•
Reject Effort
Deletes the effort.
In either case, the “ready to start effort” screen reappears (
Figure 28
on page 41).
13. Determine your next step.
•
If you want to perform another effort, go to
Step 6
on page 41.
•
If you are finished with this test, press Test Done.
Note
After each effort, a quality message appears on this screen, such as “Don’t
hesitate,” “Blow out longer,” or “Good effort.” For details, see
Note
The effort numbers increment with each new effort (FVC #1 becomes FVC
#2, and so on), even if some efforts were deleted, so the test record indicates
the patient’s total number of efforts.
FVC #1
9:17AM Oct 16 08
Doe, Jane
Accept
Effort
Reject
Effort
Curve
Flow/Vol
SVC #1
9:17AM Oct 16 08
Doe, Jane
Accept
Effort
Reject
Effort
SVC example
FVC example (flow/vol curve)
NHANES III 1999
ATS: --
Pred
Value %Pred
FVC
2.09
3.62
173.50
FEV1
3.06
3.08
100.46
FEV1%
80.86
85.01
105.14
FEV6
3.75
0.00
0.00
PEF
7.14
7.18
100.66
FEF25-75 3.00
3.29
109.81
FEV0.5
2.31
2.32
100.32
FEV2
--
3.50
--
Value
SVC
3.31
ERV
1.35
IRV
1.30
VT
0.66
BF
24.73
Tin/Tex
88.60
Vol (L)
Time (s)
5
5
Flow (L/s)
Vol (L)
10
15
20
5