Dell Acceleration Appliances for Databases User Manual
Page 52
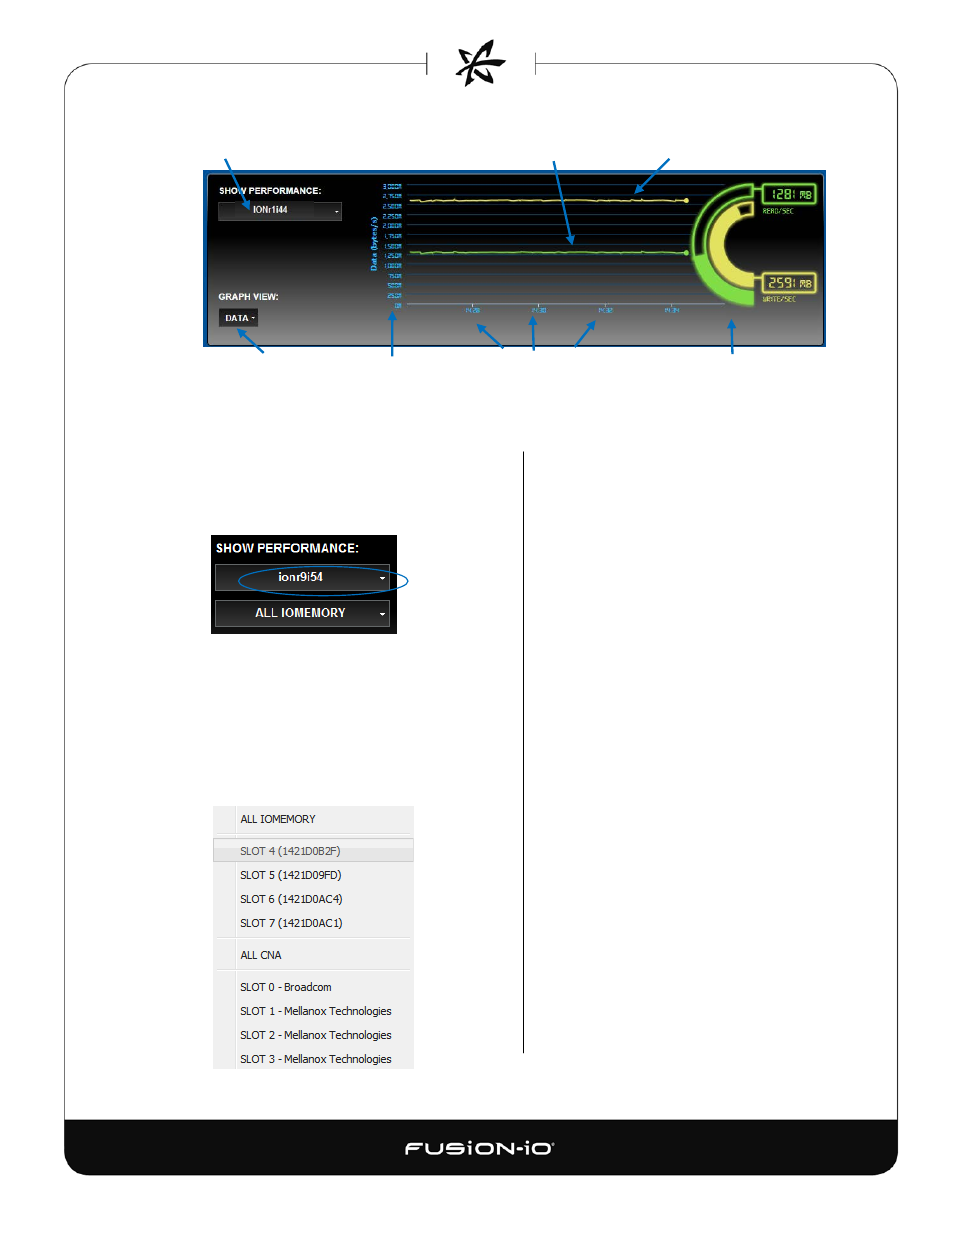
Host/cluster selection
Read performance Write performance
Data/IOPS
Data points
Time points
Performance indicator
Here are the basic elements of the graph:
• Host/cluster selection – Click the box
to select the cluster (default, if
available) or host you want to
monitor. For example:
• ioMemory selection – Click the box to
select the ioMemory module you want
to monitor, or ALL IOMEMORY; or ALL
CNA; or a selected network adapter. If
you choose ALL IOMEMORY,
performance for all ioMemory is
aggregated in the graph.
• Data/IOPS – Click the Data box to toggle
between a Data view (bandwidth) and
Operations view (IOPS). A sample IOPS
performance screen is shown below.
• Performance lines – The colored lines show
bandwidth in MB/s (if the Data box is
selected) or IOPS (if the Operations box is
selected). Green = read performance;
yellow = write performance.
• Data points – The blue numbers at the left
of the graph show fractions of the peak
performance numbers. The viewable chart
of data points rescaled when performance
values change significantly.
• Time points – As the graph area slowly
scrolls to the left in real time, new time
points (HH:MM) appear at the bottom right
of the each minute, and eventually
disappear to the left. The time range for
viewable performance data is 5 minutes.
• Performance indicator – The yellow and
green semi-circle icons at the right of the box
show bandwidth or IOPS numbers. A fully
colored circle-slice indicates that the selected
ioMemory modules are performing at or near
the most recent peak. Semi-circles are
rescaled with changes in performance peaks.
46