2 recording the actual progression – Memmert CELSIUS 10 FDA User Manual
Page 44
44
CELSIUS 10 FDA-Edition
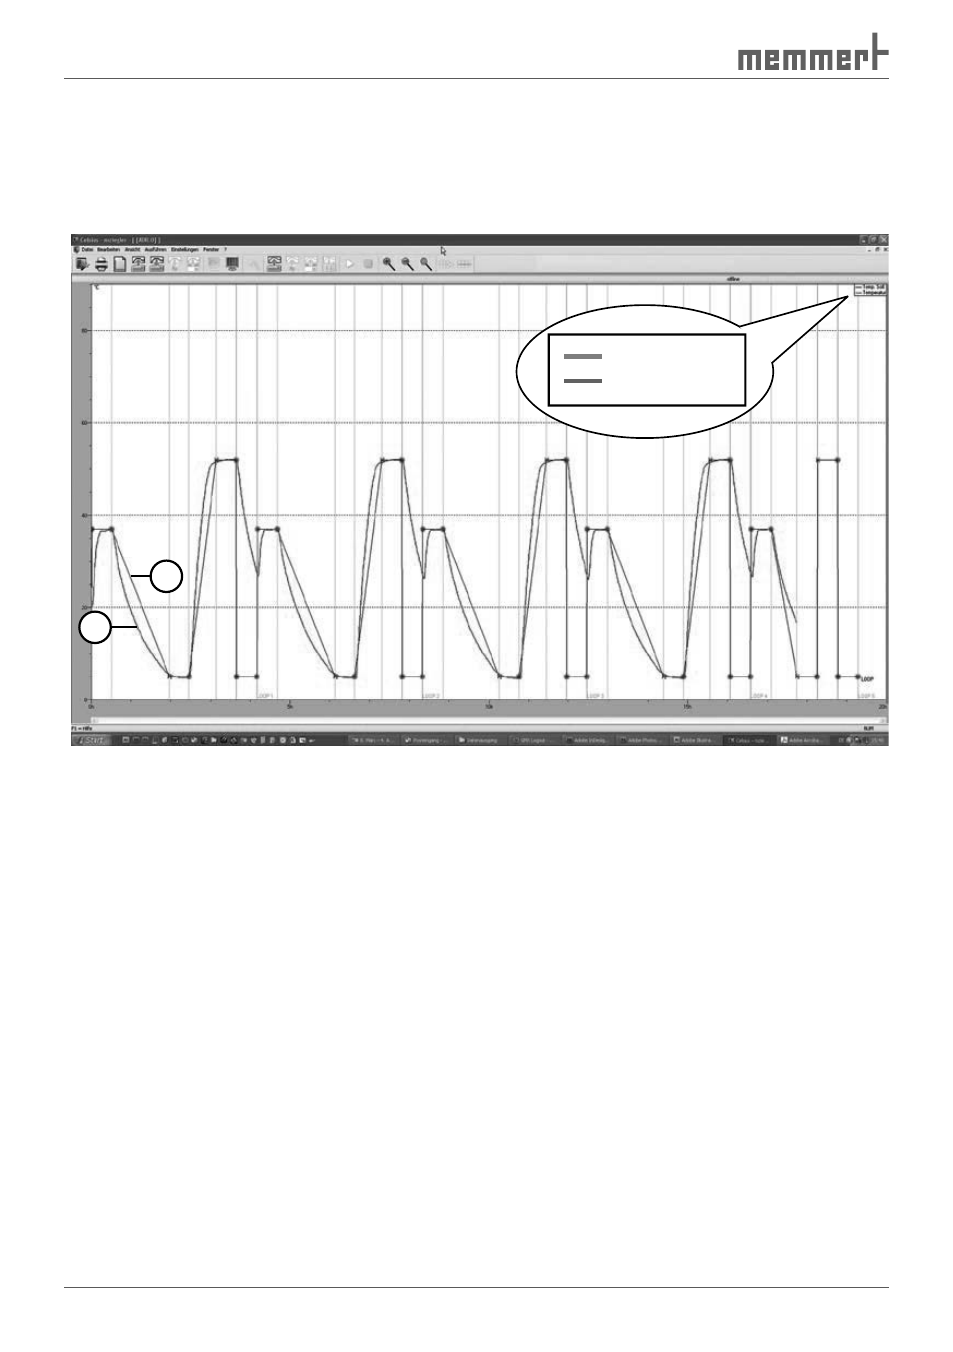
8.2.2 Recording the actual progression
When a tempering profile is run, the actual values of the oven are displayed in the graphical
view as colour curves (1) which follow the tempering profile (2). Each colour represents a dif-
ferent value (e.g. temperature, humidity), explained in a colour legend at the top right of the
window:
Temp. Set
Temperature
1
2
The display of the colour legend can be switched on and off in the in the menu via
"Settings"
→"Show Color Legends".