Vcc statistics, Figure 4.23 vcc statistics display example, Table 4.9 – Avaya M-ACCF/SF User Manual
Page 94: Statistics display items and their meanings
Chapter 4
X-Switch CLI & ATM Terminal Interface
78
Avaya M770 M-ACCF/SF ATM Access Modules User’s Guide
VCC Statistics
The VCC Statistics screen provides an overview of traffic flow in each VCC.
To view the VCC statistics:
1
Select the [2] atm option in the Main Menu. The ATM submenu (see Figure 4.21)
appears.
2
Select the [2] vcc option in the ATM submenu and observe the ATM/VCC
submenu (see Table 4.5) appear.
3
Select the [2] Statistics option.
4
Enter the VPI /VCI of the VCC traffic you want to monitor.
5
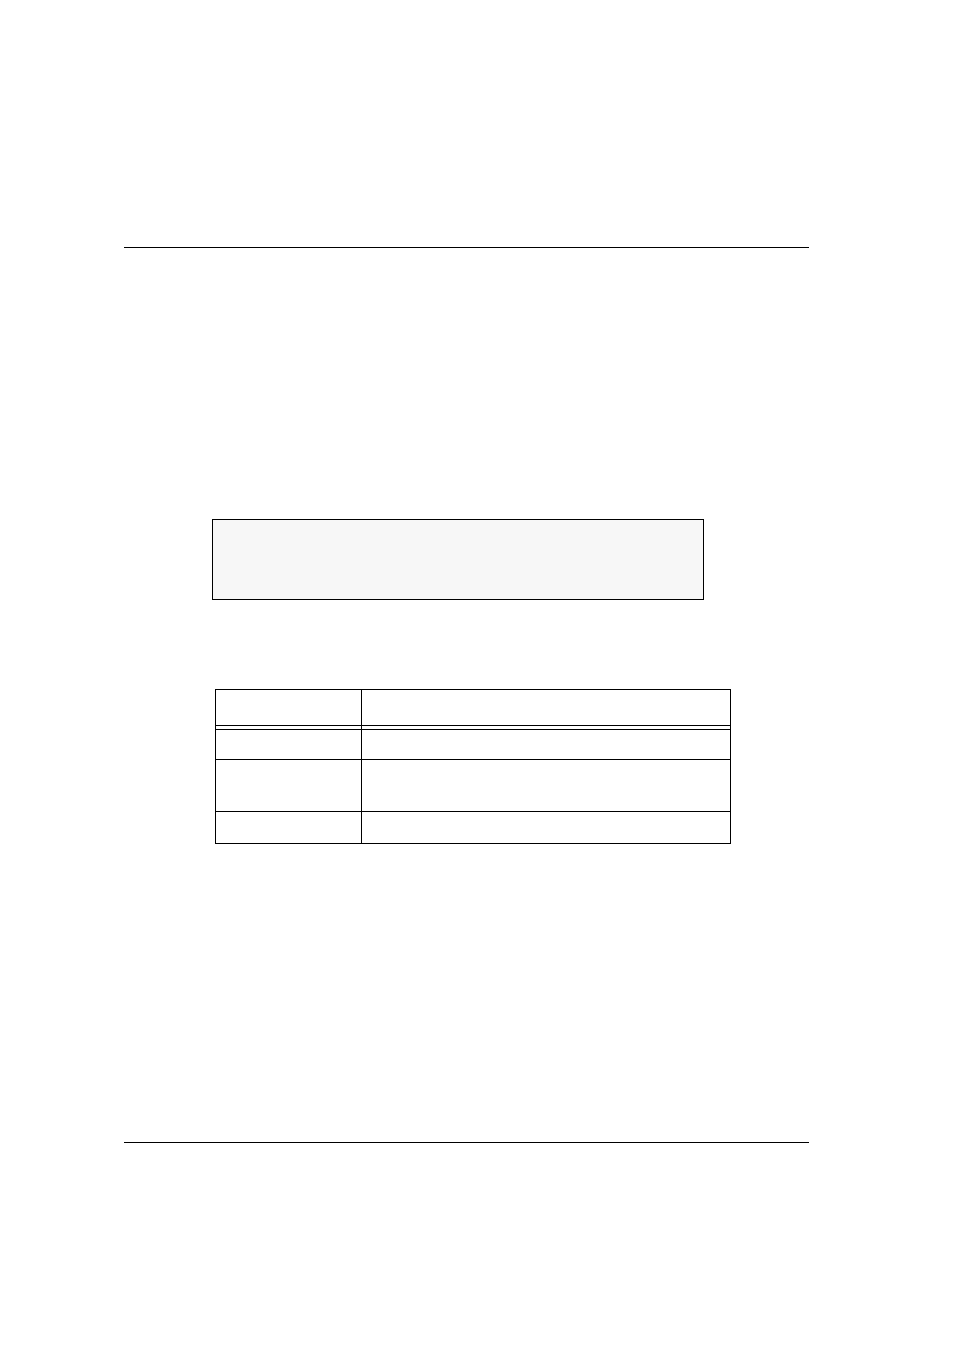
The VCC Statistics display (see Figure 4.23) appears.
Figure 4.23
VCC Statistics Display Example
The parameters of this display are explained in Table 4.9 below.
Table 4.9
Statistics Display Items and their Meanings
Display Item
Meaning
In Cells
Number of incoming ATM cells received by VCC
Bad CRC Frames
Number of incoming ATM frames with CRC
error
Out Cells
Number of ATM cells transmitted by VCC
In Cells : 434
Bad CRC Frames: 0
Out Cells : 0