Figure 4.22 atm port statistics screen, Table 4.8, Port statistics display items and their meanings – Avaya M-ACCF/SF User Manual
Page 93
Chapter 4
X-Switch CLI & ATM Terminal Interface
Avaya M770 M-ACCF/SF ATM Access Modules User’s Guide
77
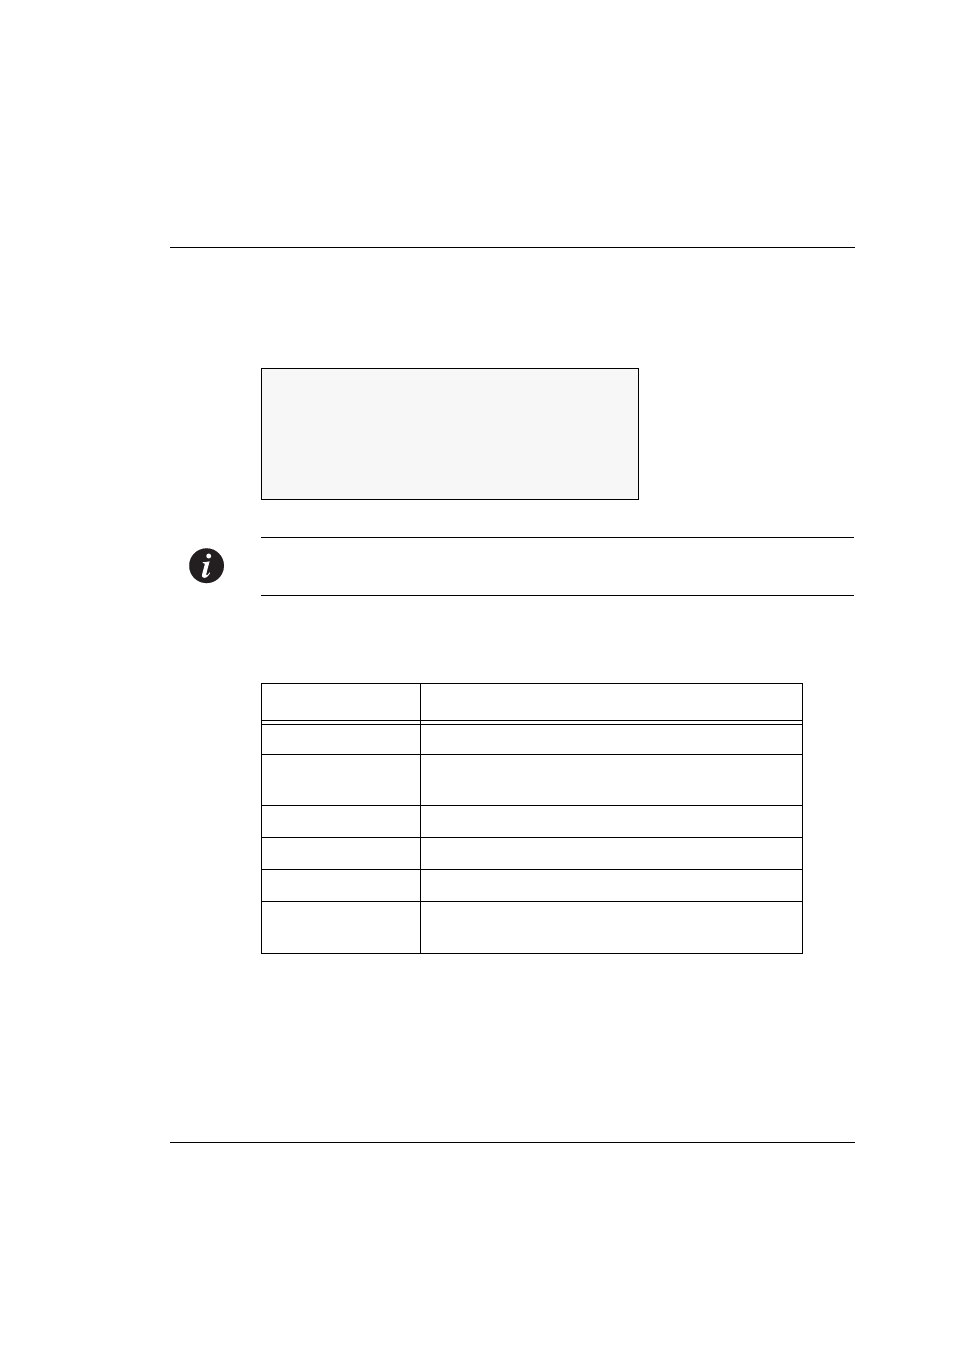
Select the [2] vcc option to generate the Atm Port Statistics display. Then select
the [2] statistics option.
An example of the ATM Port Statistics screen is shown in Figure 4.22.
Figure 4.22
ATM Port Statistics Screen
Note:
The figures shown for each statistic on this screen include ATM management
traffic and normal Ethernet traffic.
The parameters of this display are explained in Table 4.8 below.
Table 4.8
Port Statistics Display Items and their Meanings
Display Item
Meaning
In Cells
Number of incoming ATM cells received
In Frames
Number of incoming Ethernet frames received by
port
In Errored Frames
Number of incoming Ethernet frames with error
Out Cells
Number of ATM cells transmitted
Out Frames
Number of Ethernet frames transmitted by port
Out Errored
Frames
Number of outgoing Ethernet frames with error
In Cells: 23
In Frames: 11
In Errored Frames: 0
Out Cells: 14
Out Frames: 5
Out Errored Frames: 0