2 histogram – Triton Bathymetry User Manual
Page 29
Page 25
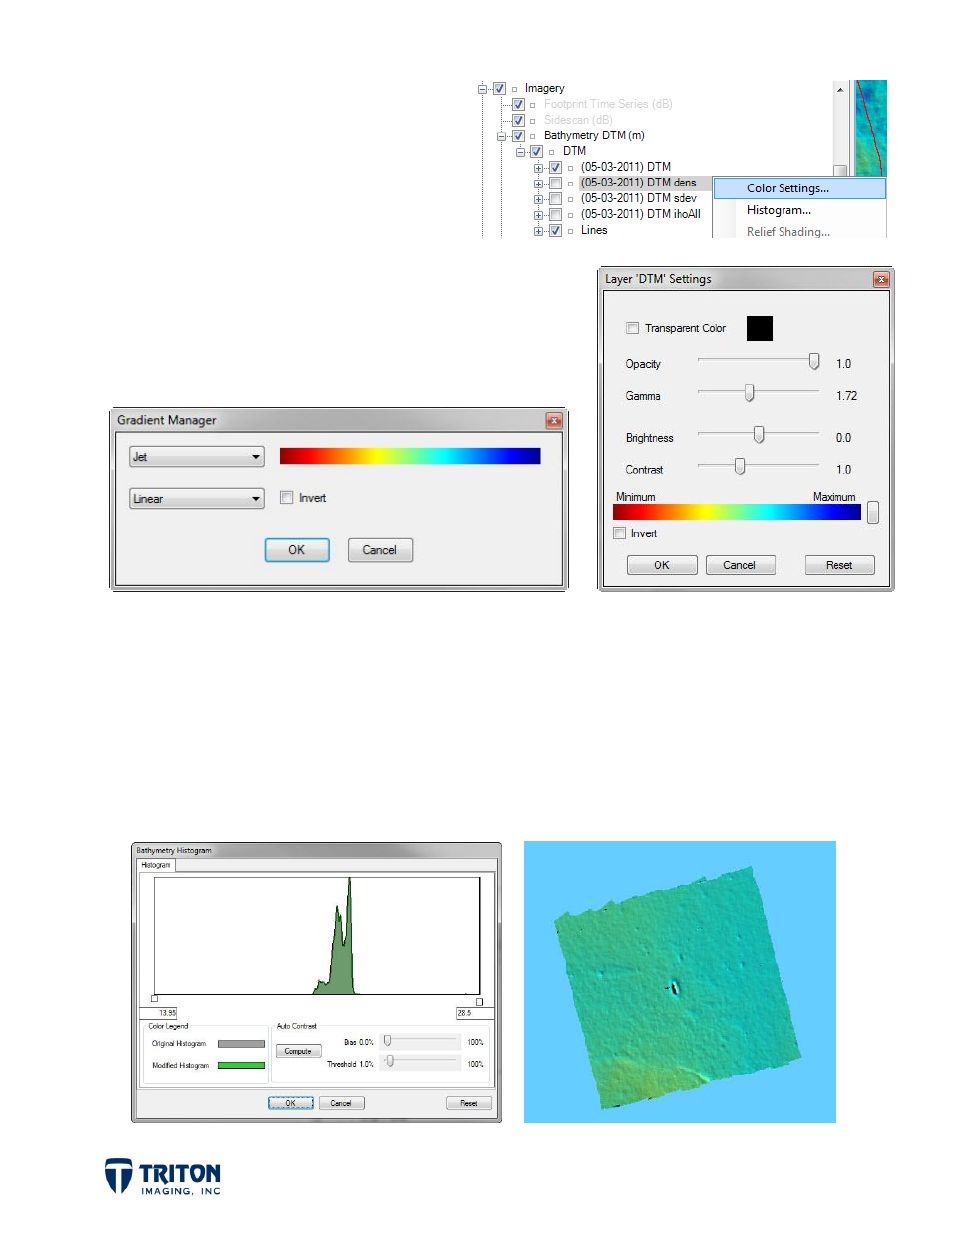
For adjusting the color of an individual
grid layer, right click on the layer name
in the file tree. The example shown
right is for opening the
Density
color
settings.
Selecting the Color Settings for any layer will open
the window shown to the right. Apart from changing
the color bar as shown in the window below, increasing
the
Gamma
can help bring out the details in the grid.
6.2 Histogram
Changing the histogram adjusts how the color map is spread across the data range. The
Histogram
is accessed the same as the
Color Settings
by right-click root bathymetry file
tree nodes or on the individual grid layer.
Selecting the
Histogram
menu option will open the window below. With the
Histogram
stretched to the full range of the data, the bathymetry image is mostly one color.