Adding horizontal lines to graphs – Vaisala vLog 4.5 User Manual
Page 86
Adding Horizontal Lines to Graphs
80
©
2011 Vaisala Canada Inc
affected by any settings related to sample
smoothing.
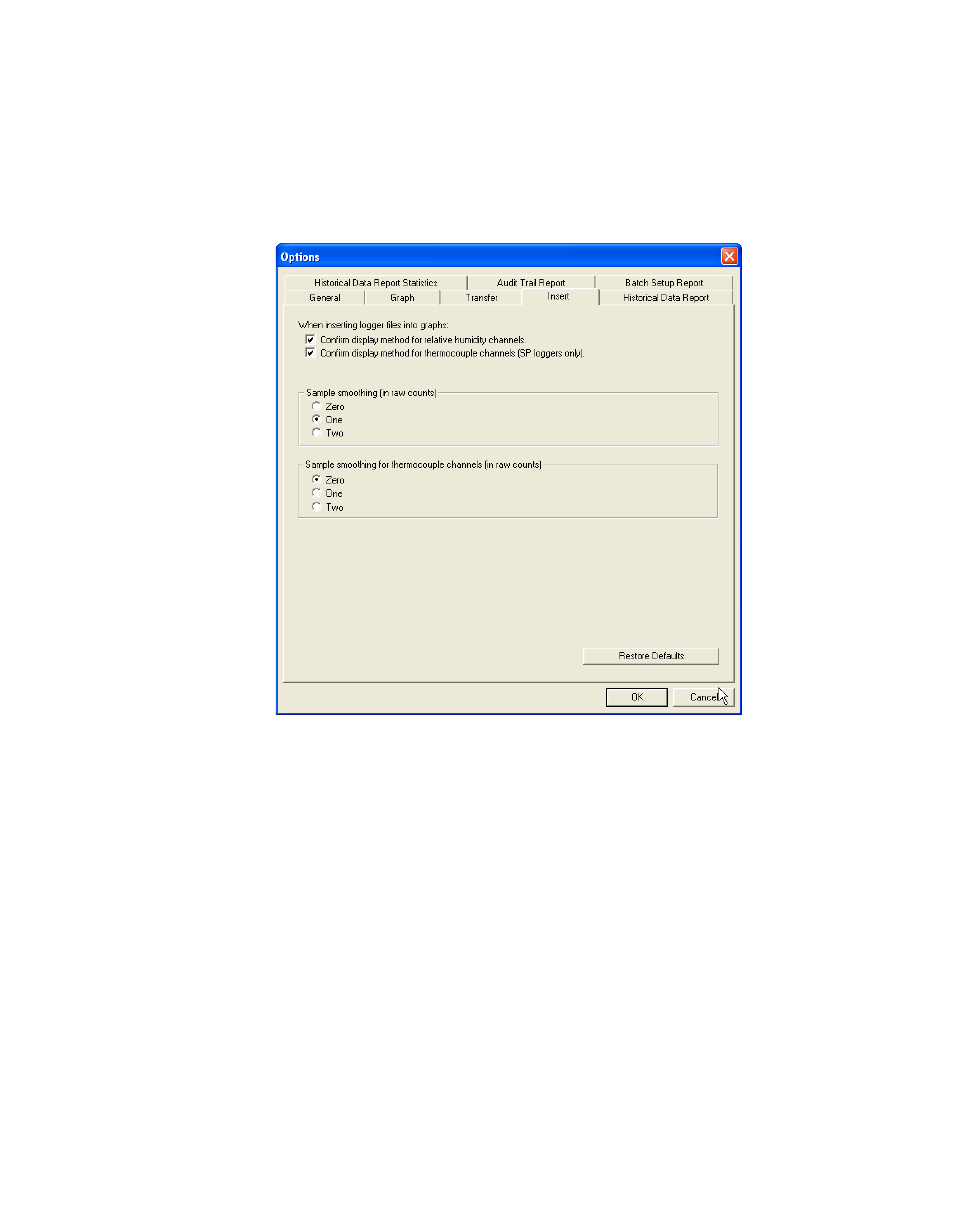
To set sample smoothing:
1
Select
Tools | Options
, then choose the
Insert
tab.
2
Under Sample smoothing (in raw counts), select one of
the following options.
•
Zero
- produces the most responsive graph, but makes
the recorded readings susceptible to noise
•
One (default)
- suitable for most applications
•
Two
- decreases input noise and produces a more
stable graph
3
Click
OK
.
Adding Horizontal Lines to Graphs
Horizontal lines add value to vLog graphs by showing
maximum, minimum, and average values, as well as
indicators as chosen by you.