Switch statistics, Using switch statistics, Chapter 3 — switch statistics – Avaya P120 SMON User Manual
Page 23
Avaya P120 SMON User Guide
16
3
Switch Statistics
Switch Statistics provides you with detailed information about the traffic
passing through a switch. For a detailed overview of Switch Statistics,
refer to “Switch Statistics Overview” on page 4.
Using Switch Statistics
To access the Switch Statistics window:
Click .
Or
Select
View >
Switch Statistics
. The Switch Statistics window
opens.
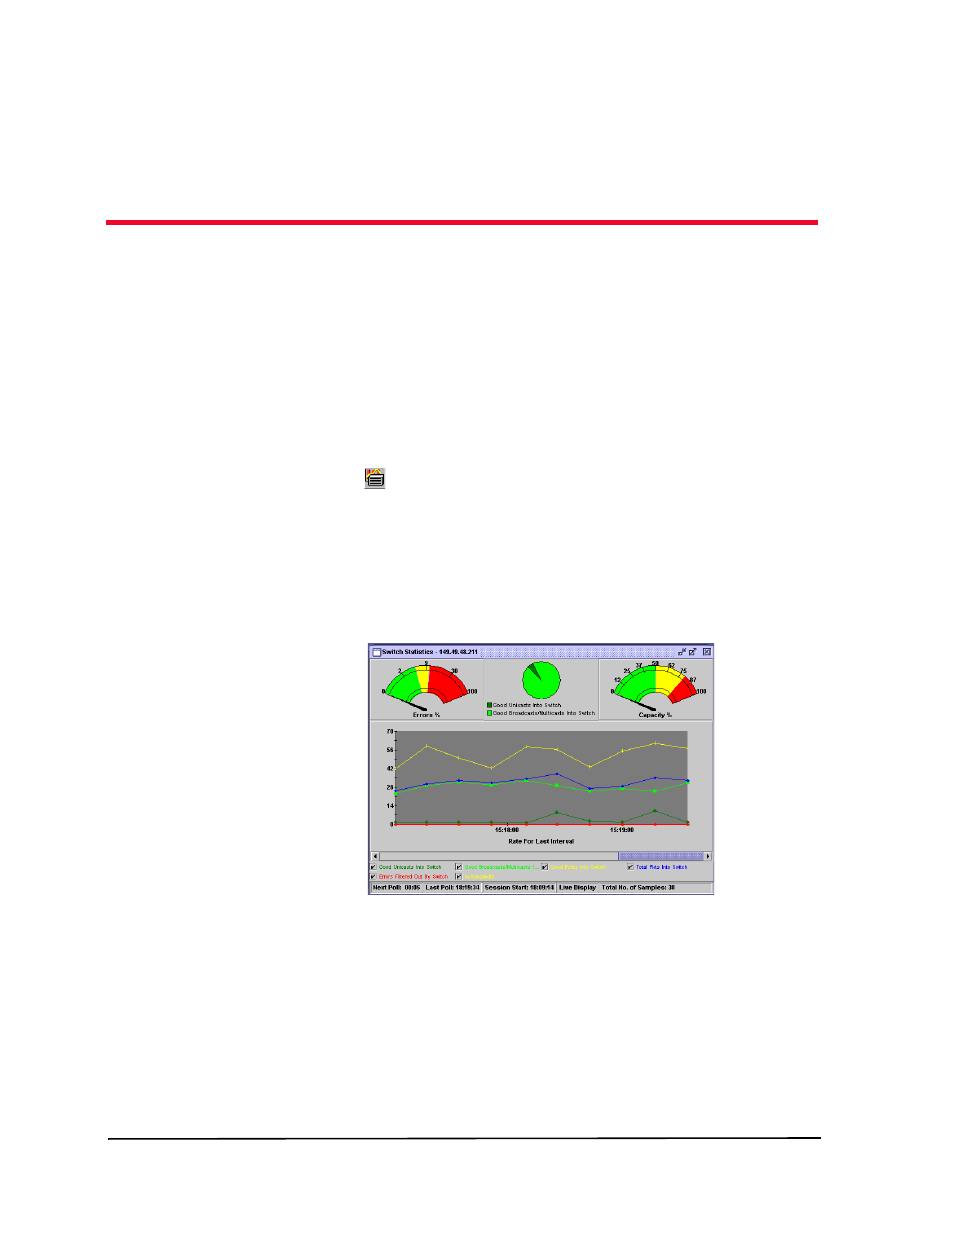
Figure 3-1. Switch Statistics Window
Switch Statistics displays information using different types of graphs:
•
Gauges that show error packets and capacity.
•
A pie chart that shows the ratio of Unicast to Non-Unicast
packets.
•
A traffic graph section that contains line graphs describing the
characteristics of the traffic traveling through the switch.