Software menu system, English 99, Phosphax σ sigma menu overview – Hach-Lange PHOSPHAX sigma Basic User Manual User Manual
Page 99: Phosphax sigma
English 99
Software menu system
Phosphax Σ sigma menu overview
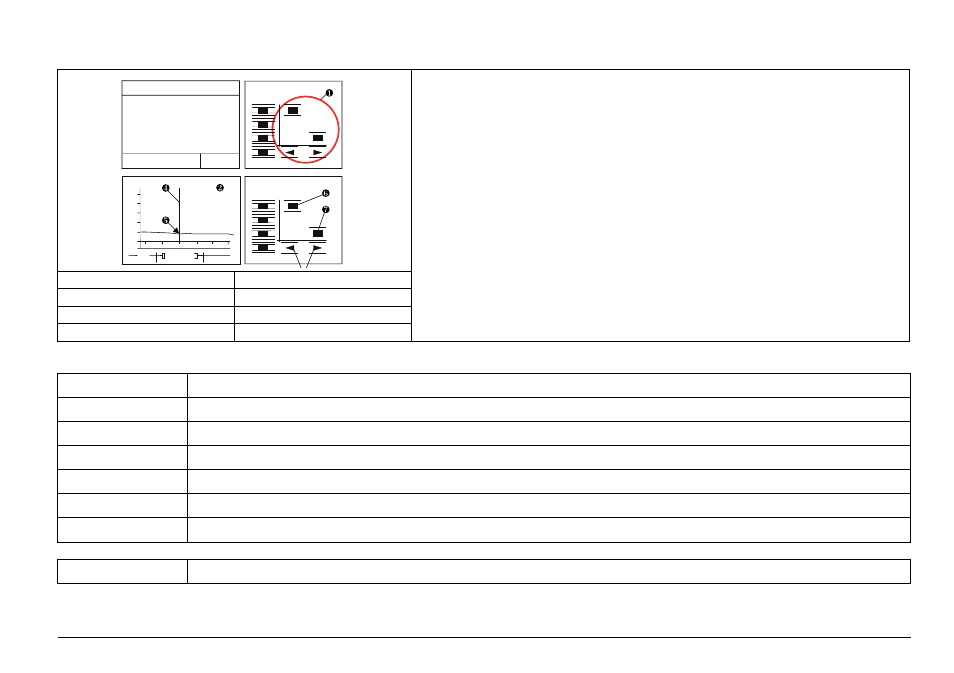
Graphic functions
When you press one of the four graphic keys for 3 seconds, the display switches to the graphic
mode with curve diagram. Via the now active graphic keys a whole series of different displays can
be shown on the display.
Operate graphic keys
The two large arrow keys below move the cursor on the curve. The data of the intersection
point of the cursor/curve can be found underneath the diagram shown.
With the two X and Y keys, you change the scale of the corresponding axes:
Axis scale
X axis (time axis): 12 h, 24 h, 48 h, 7 days, 28 days
Y axis (measurement value axis in %): dependent on the cursor/curve intersection point
5 %, 10 %, 50 %, 100 % around this intersection point
Note: 100 % = set measurement range for the current output,
menu item [CURRENT RANGE 0..]
1
Graphic keys
2
Curve diagram
3
Arrow keys
4
Cursor
5
Intersection data point
6
X key/X axis
7
Y key/Y axis
100
20
40
80
60
12
00
8
00
4
00
6
00
10
00
14
00
8:00 14.07
1.9 mg/l P
100%
10
Y
F1
Y
X
F4
F3
F2
Z
O
O
M
Menue
Grafik
F1
Y
X
F4
F3
F2
Z
O
O
M
Menue
Grafik
14:01:20
04.11.12
12,0
PHOSPHAX sigma
mg/l P
SETTINGS
Setting of all device parameters: This includes measurement range, correction factor, current output, date, time etc.
INPUT SIGNALS
Device-internal measurement data
OUTPUT TEST
Check of all connected data lines
SERVICE
Maintenance- and repair work
STATUS
Error description and acknowledgement
CURVE
Presetting of the measurement data graphic
MODBUS
Setting of the MODBUS parameters
SETTINGS
ADJ. CONTRAST (display readability)