Figure 7, Figure 8, Lineage power 8 – GE Industrial Solutions QRW010-025-035-040 Series User Manual
Page 8: Input voltage and current characteristics
Lineage Power
8
Data Sheet
August 24, 2010
36 Vdc - 75 Vdc Input, 1.0 to 12 Vdc Output; 10 A to 40 A
QRW010/025/035/040 Series Power Modules; dc-dc Converters
Characteristic Curves
The following figures provide typical characteristics curves for the QRW040A0P (VO = 1.2 V) module at room temperature (TA
= 25 °C)
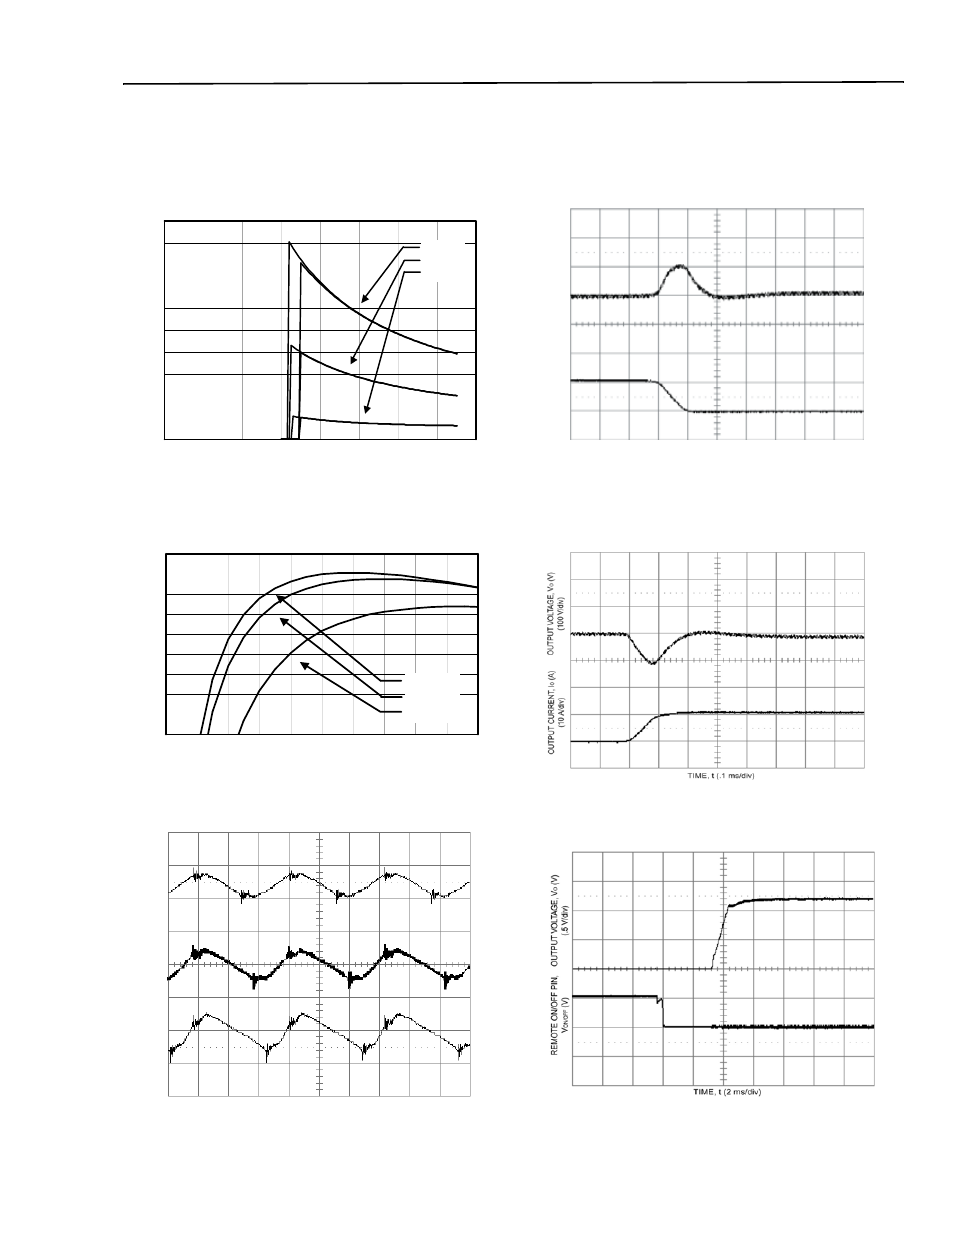
Figure 7.
Input Voltage and Current Characteristics.
Figure 8.
Converter Efficiency vs. Output Current.
Figure 9.
Output Ripple Voltage (IO = IO, max).
Tested with a 220µF aluminium and a 1.0µF ceramic
capacitor across the load.
Figure 10. Transient Response to Step Decrease in
Load from 50% to 25% of Full Load
(VI = 48 Vdc).
Figure 11. Transient Response to Step Increase in
Load from 50% to 75% of Full Load
(VI = 48 Vdc).
Tested with a 10µF aluminium and a 1.0µF tantalum capacitor
across the load.
Figure 12. Start-up from Remote On/Off (IO = IO, max).
0
0.2
0.4
0.6
0.8
1
1.2
1.4
1.6
1.8
2
0
10
20
30
40
50
60
70
80
INP
U
T CU
RR
E
NT
, I
I
(A
)
I
O
= 40 A
I
O
= 20 A
I
O
= 4 A
70
72
74
76
78
80
82
84
86
88
0
4
8
12
16
20
24
28
32
36
40
OUTPUT CURRENT, I
O
(A)
EFFI
CI
ENC
Y
,
η
(%
)
V
I
= 36 V
V
I
= 48 V
V
I
= 75 V
TIME t, (1µs/div)
36V, 40A
48V, 40A
75V, 40A
OUTPUT V
OL
T
A
GE, V
O
(V)
(50 mV/div)
TIME, t (.1 ms/div)
O
U
TP
UT
CURRE
NT
, I
(A
)
O
(1
0 A
/d
iv
)
O
U
TP
U
T V
O
LT
AG
E,
V
(V
)
O
(1
00
m
V
/d
iv
)