Figure 43, Figure 44, Figure 48 – GE Industrial Solutions QRW010-025-035-040 Series User Manual
Page 26
Lineage Power
26
Data Sheet
August 24, 2010
36 Vdc - 75 Vdc Input, 1.0 to 12 Vdc Output; 10 A to 40 A
QRW010/025/035/040 Series Power Modules; dc-dc Converters
Characteristic Curves
The following figures provide typical characteristics curves for the QRW010A0B (VO = 12.0V) module at room temperature (TA
= 25 °C)
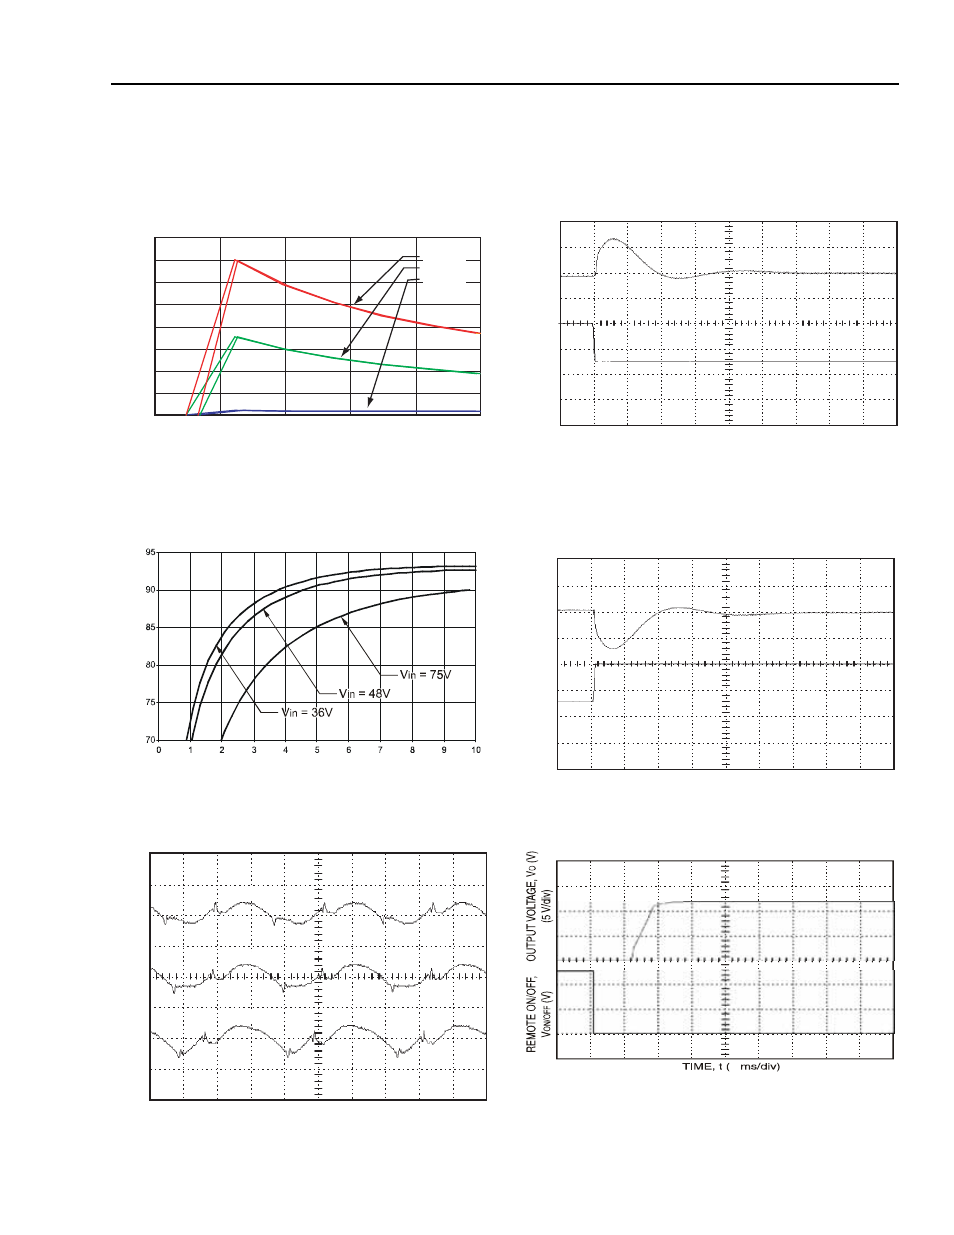
Figure 43.
Input Voltage and Current Characteristics.
Figure 44.
Converter Efficiency vs. Output Current.
Figure 45. Output Ripple Voltage (IO = IO, max).
Tested with a 220µF aluminium and a 1.0µF ceramic capacitor
across the load.
Figure 46. Transient Response to Step Decrease in
Load from 50% to 25% of Full Load
(VI = 48 Vdc).
Figure 47. Transient Response to Step Increase in Load
from 50% to 75% of Full Load
(VI = 48 Vdc).
Tested with a 10µF aluminium and a 1.0µF tantalum capacitor across
the load.
Figure 48.
Start-up from Remote On/Off (IO = IO,
max).
0
0.5
1
1.5
2
2.5
3
3.5
4
25
35
45
55
65
75
INPUT VOLTAGE, V
I
(V)
INPUT CURRENT, I
I
(A)
I
O
= 10 A
I
O
= 5 A
I
O
= 0 A
E
FFI
C
IEN
C
Y,
(
%
)
η
OUTPUT CURRENT, Io (A)
TIME, t (1 µs/div)
OUTPUT V
OL
TA
GE, V
O
(V)
(50 mV/div)
V
I
= 36 V
V
I
= 48 V
V
I
= 75 V
TIME, t (100 µs/div)
OUTPUT V
OL
TA
GE, V
O
(V)
(200 mV/div)
O
UTPUT CURRENT
, I
O
(A)
(2 A/div)
TIME, t (100 µs/div)
OUTPUT V
OL
TA
GE, V
O
(V)
(200 mV/div)
O
UTPUT CURRENT
, I
O
(A)
(2 A/div)
2