Guralp Systems ART User Manual
Page 50
ART
Also shown in this figure (if the ‘Display metadata’ option is
selected in the ‘Options’ window) are the basic earthquake,
waveform and station metadata of the selected time-history.
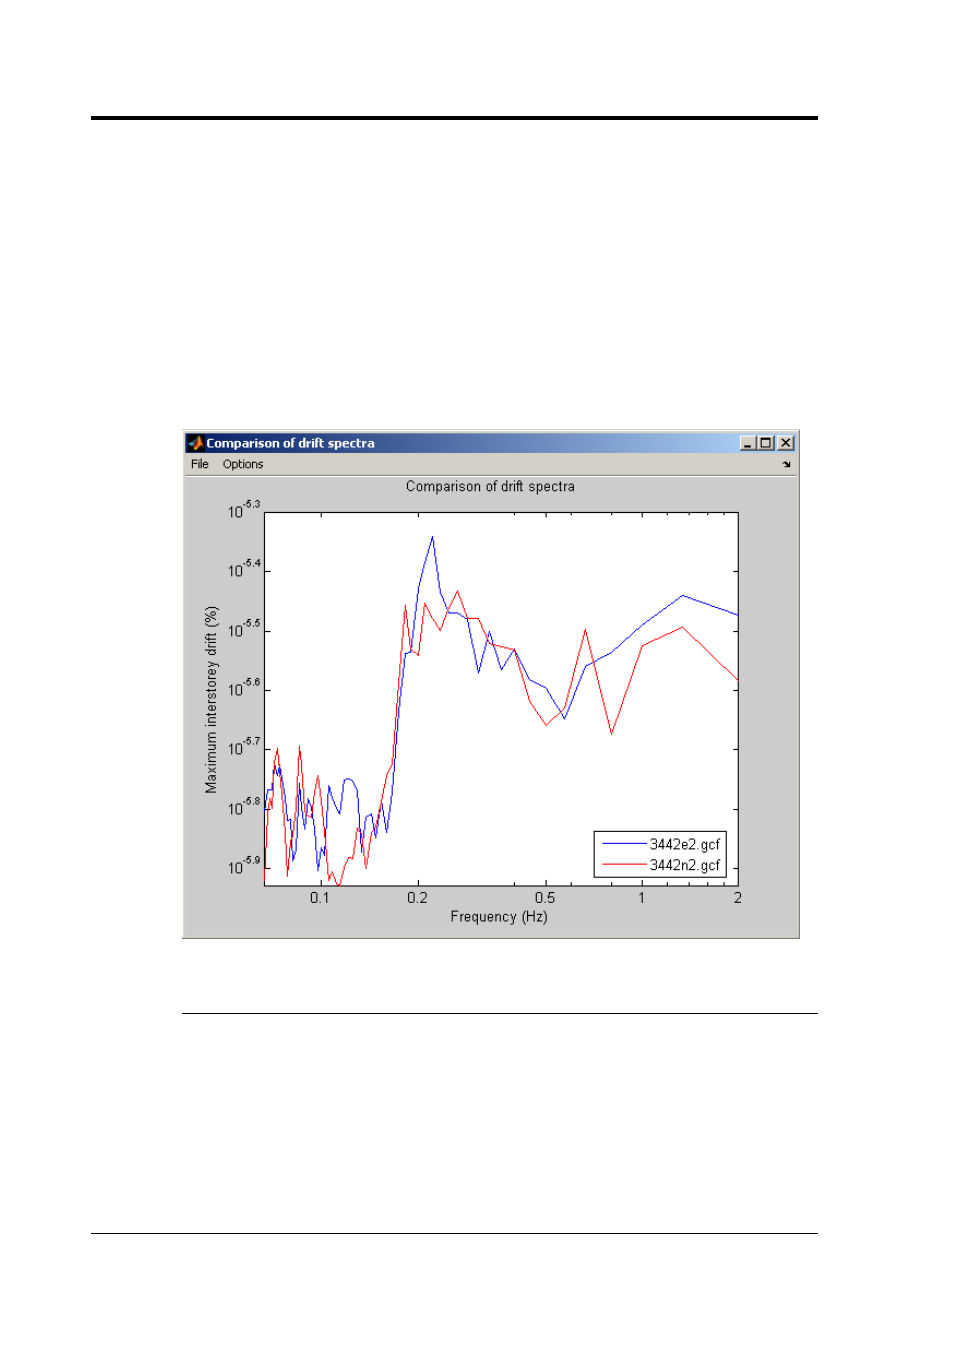
Multiple time-histories selected
Clicking on this button when multiple time-histories have been
selected calculates and plots the drift spectra (e.g. Iwan, 1997)
of the currently selected time-histories for the damping level
and material type specified in the ‘Options’ window and
displays them on the same graph so that they can be easily
compared (see below).
3.2.21 Comparisons
Clicking on this button opens a new window (see below) that
allows the user to compare the observed elastic response
spectra of the selected time-histories with predicted median
spectra from 21 recent GMPEs (e.g. Douglas, 2003) and three
seismic design codes. The GMPEs that can be selected by
clicking on the check-boxes are the following:
1.
Abrahamson & Silva (1997) (AS97);
50
Issue C