Guralp Systems ART User Manual
Page 46

ART
to their limited applicability in engineering
seismology/earthquake engineering). This calculation takes a
few seconds for a normal length time-history. The method
given in Beaudet & Wolfson (1970) is used to calculate the
spectra. The spectra are plotted on tripartite and standard
(logarithmic or linear, depending on the choice made in the
‘Options’ window) plots for spectral acceleration, spectral
velocity and spectral displacement. The spectra are displayed
using the units selected by the user in the ‘Options’ window.
Also shown in this figure (if the ‘Display metadata’ option is
selected in the ‘Options’ window) are the basic earthquake,
waveform and station metadata of the selected time-history.
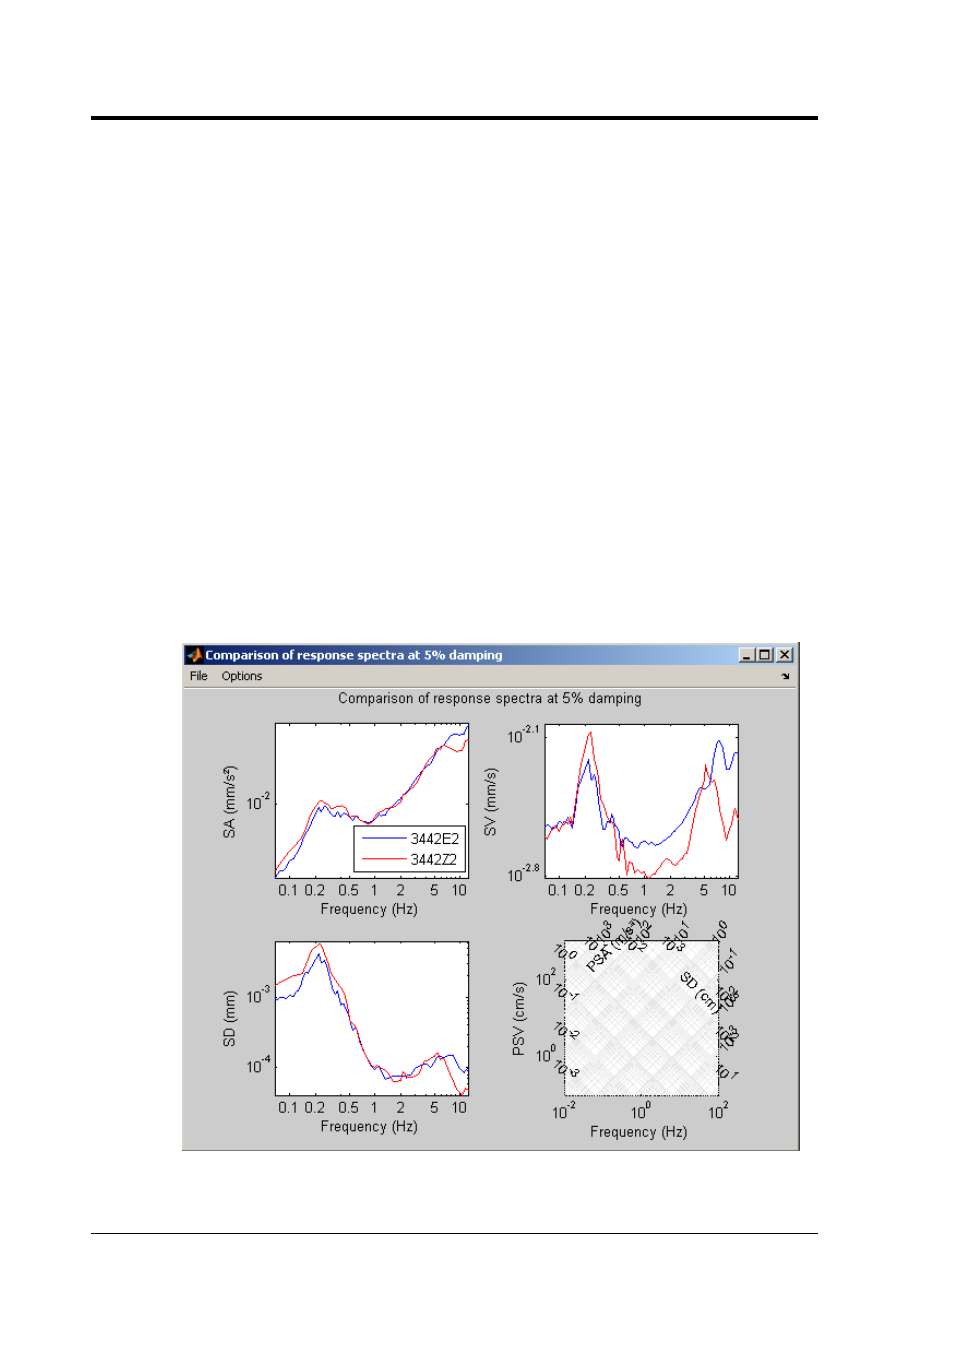
Multiple time-histories selected
Clicking on this button when multiple time-histories have been
selected calculates and plots the elastic response spectra of
the currently selected time-histories for the damping level
specified in the ‘Options’ window and displays them on the
same sub-figures so that they can be easily compared (see
below).
46
Issue C
