Guralp Systems ART User Manual
Page 44
ART
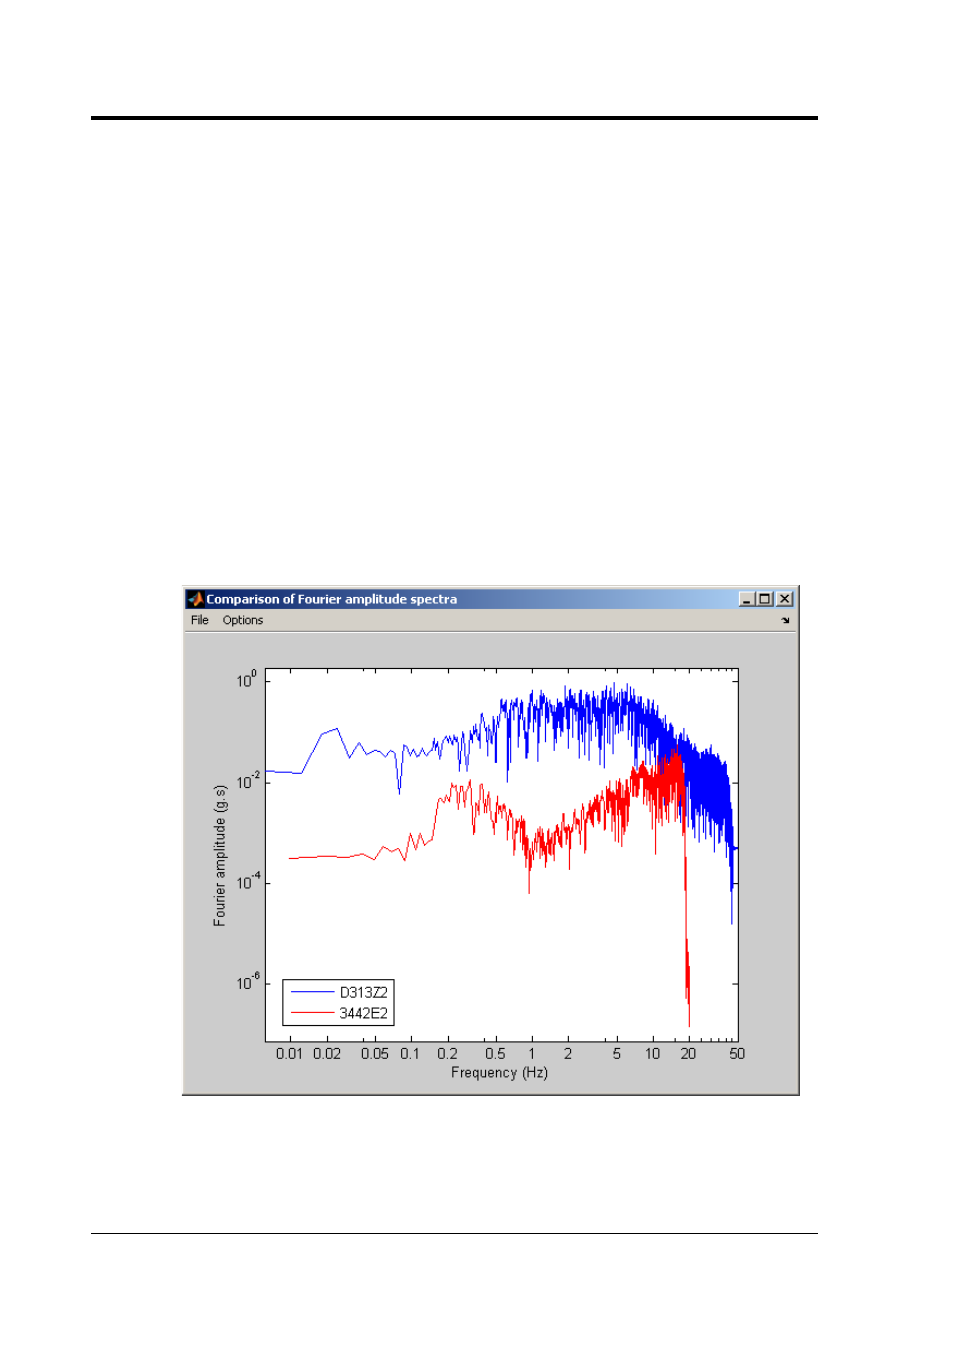
record. Comparing these two spectra enables a choice of the
high-pass cut-off frequency to be made.
The figure above shows an example where a cut-off frequency
of about 1.5Hz is suggested by comparing the two spectra
because for lower frequencies the signal-to-noise ratio is quite
low.
A sub-figure underneath can be requested in the ‘Options’
menu at the top of the figure to show the signal-to-noise
spectral ratio computed using the Fourier amplitude spectra of
the pre-event portion (as an estimate of the noise) and the
remainder of the record (as an estimate of the signal).
Also shown in this figure (if the ‘Display metadata’ option is
selected in the ‘Options’ window) are the basic earthquake,
waveform and station metadata of the selected time-history.
Multiple time-histories selected
Clicking on this button when multiple time-histories have been
selected calculates and plots the Fourier amplitude spectra of
44
Issue C