Guralp Systems ART User Manual
Page 40
ART
Also displayed on the graph are dashed lines showing the times
the intensity first exceeds the proportion of final Arias intensity
given in the ‘Options’ window (‘Significant Relative (Start)’ and
‘Significant Relative (End)’.)
Also shown in this figure (if the ‘Display metadata’ option is
selected in the ‘Options’ window) are the basic earthquake,
waveform and station metadata of the selected time-history.
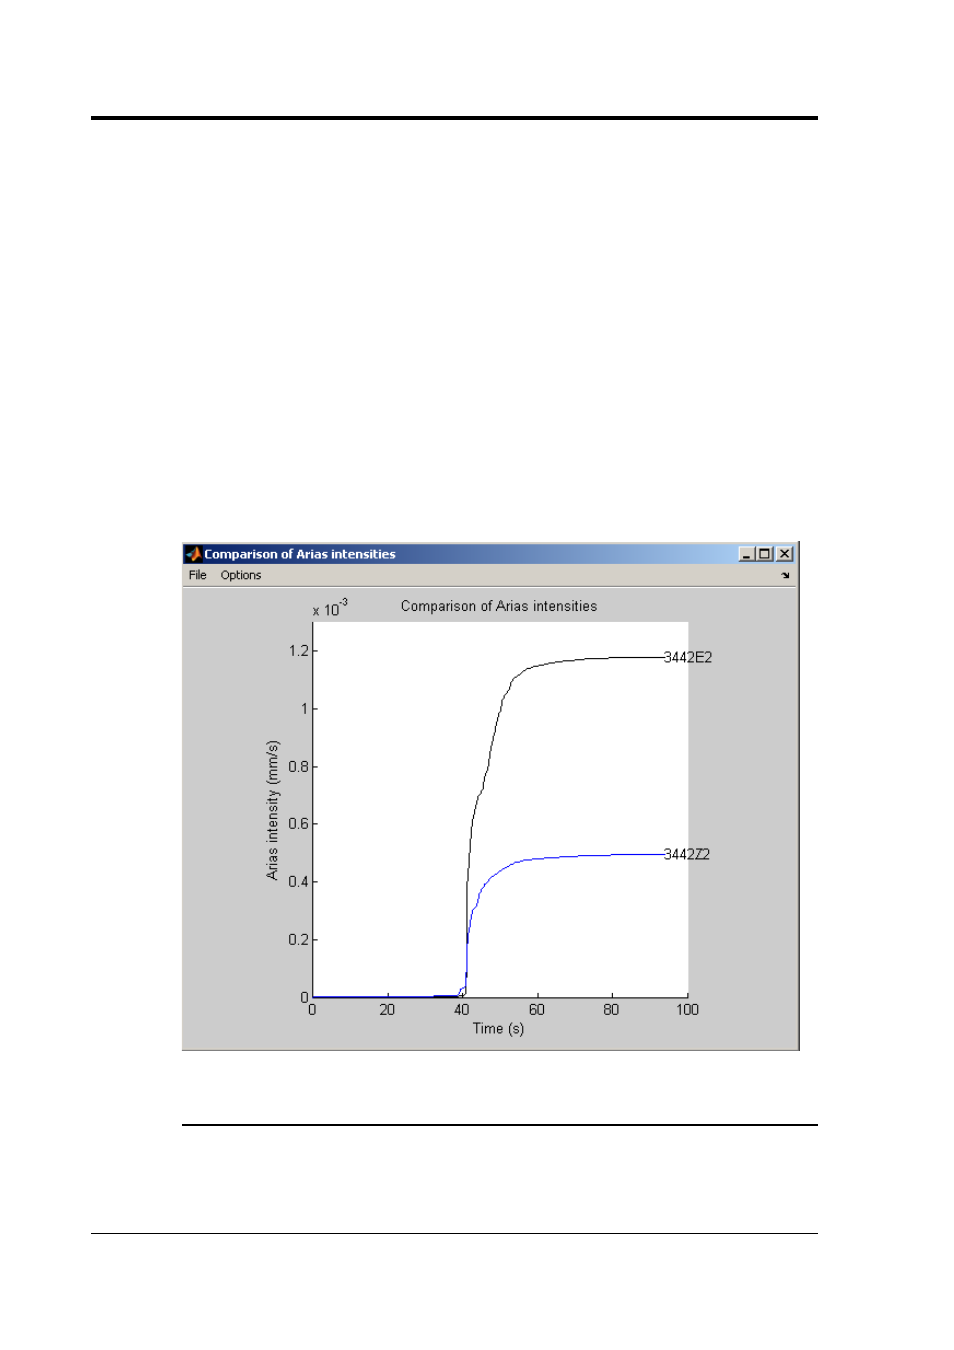
Multiple time-histories selected
Clicking on this button when two or more time-histories are
selected calculates and displays the Husid plots for all the
selected time-histories on the same graph so that they can be
easily compared (see below). The figure is either displayed in
colour or in monochrome depending on the option selected by
the user within the ‘Options’ window.
3.2.16 Energy density plot
As for other functions this button also has two behaviours
depending on whether a single or multiple time-histories have
been selected. The windows produced can be saved in different
40
Issue C