Guralp Systems ART User Manual
Page 36

ART
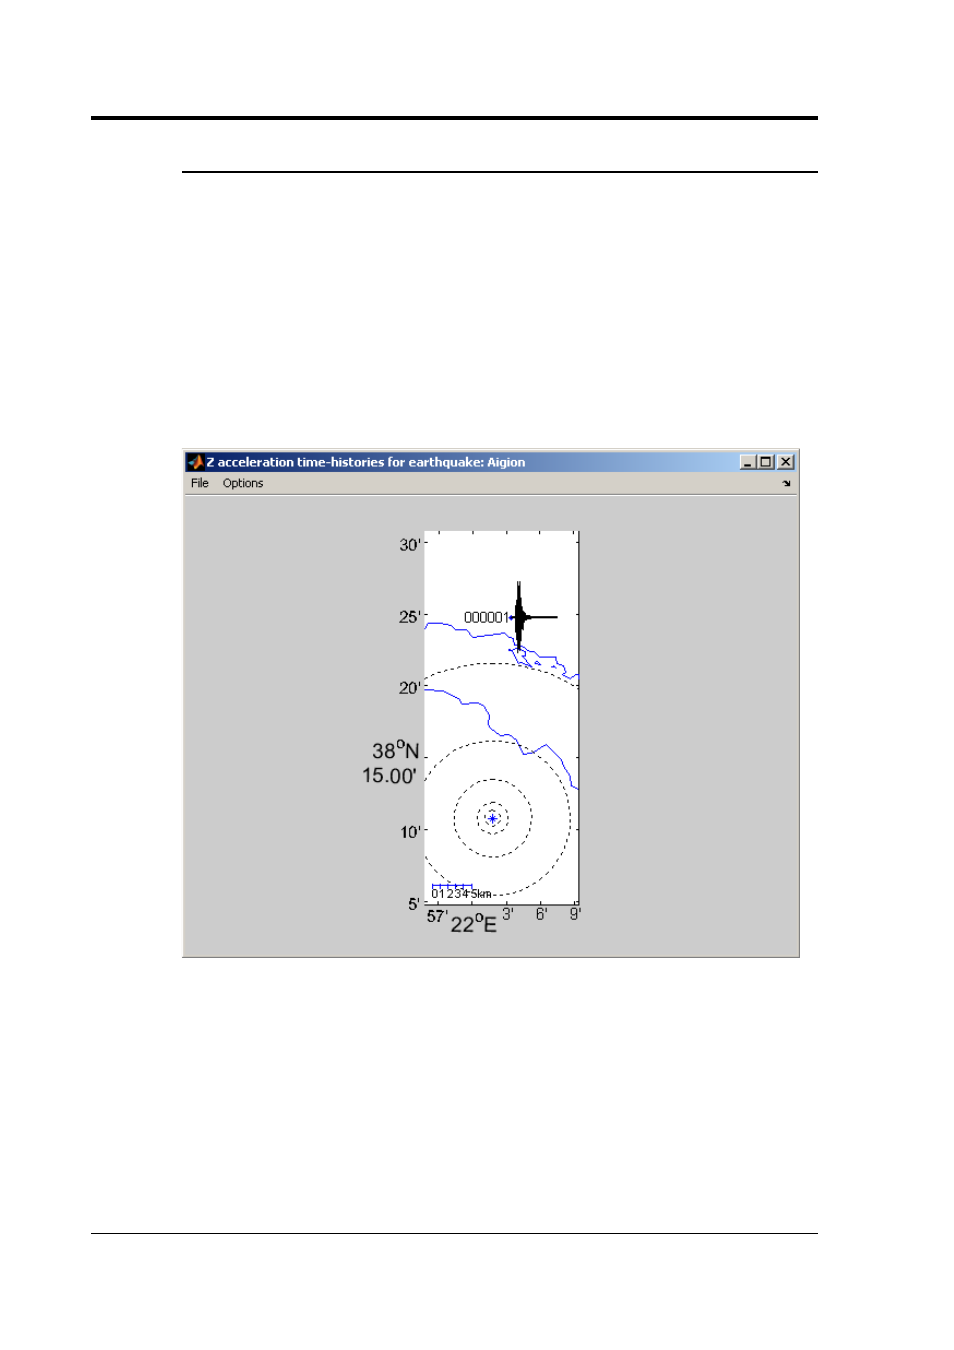
3.2.13 View time-histories on map
If the user has entered earthquake and station metadata for
the selected time-histories, the ‘View time-histories on map’
button is enabled. Clicking on this button produces a map
displaying the selected time-histories (only those for the same
earthquake as the first time-history selected in the central list-
box and for the component direction selected in the ‘Options’
window) at their geographical positions. In addition, the
epicenter of the earthquake is indicated as an asterisk as are
range rings (if this option is selected in the ‘Options’ window)
marking epicentral distances of 1, 2, 5, 10, 20, 50, 100, 200,
500 and 1000km.
At the top of this window there is a menu called ‘File’ with two
items: ‘Save figure’, which saves a copy of the window as a
graphics file (in .bmp, .eps, .jpg, .png or .tif format) and
‘Print figure’, which prints a copy of the window. Also at the top
of the window there is a menu called ‘Options’ that allows the
user to modify the drawing options of this figure.
36
Issue C
