Guralp Systems ART User Manual
Page 45

User guide
the currently selected time-histories for the period after the
pre-event portion of the record.
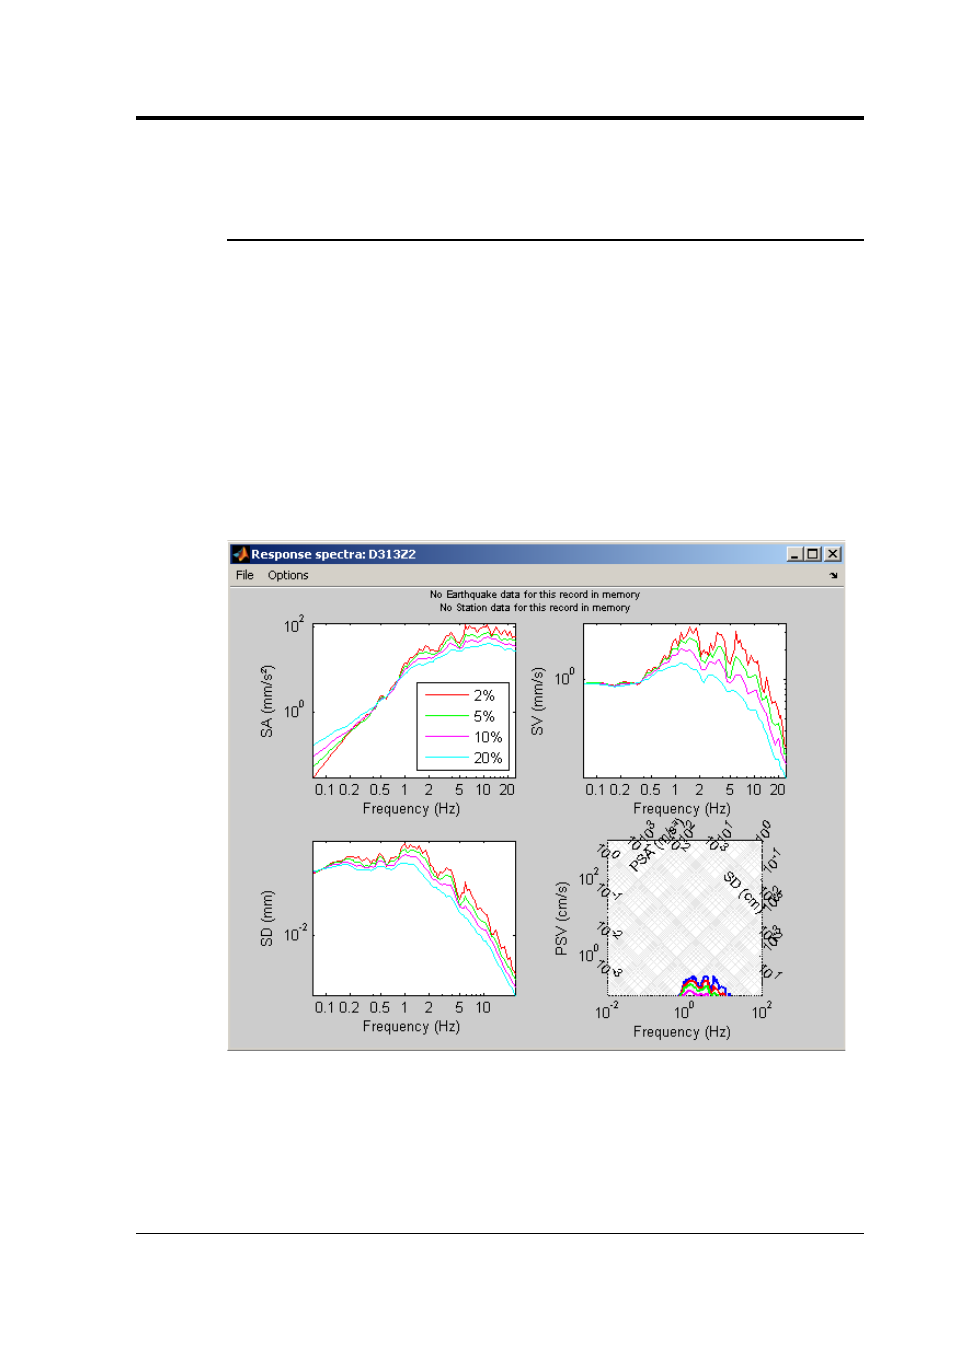
3.2.18 Elastic response spectra
This function has two behaviours, depending on whether single
or multiple time-histories have been selected. The windows
produced can be saved in different graphical formats (.bmp,
.eps, .jpg, .png or .tif) using the ‘Save figure’ option on
the ‘File’ menu and printed using the ‘Print figure’ option the
‘File’ menu. The figures are either displayed in colour or in
monochrome depending on the option selected by the user
within the ‘Options’ window. The options used to create the
figure can be changed within the ‘Options’ menu located at the
top of the window.
Single time-history selected
Clicking on this button when only a single time-history has
been selected calculates and plots the elastic response spectra
of the currently selected time-history for 2, 5, 10 and 20%
damping and periods between 0.04 and 15 seconds. (The un-
damped spectra are also computed but are not displayed due
May 2009
45
