Guralp Systems ART User Manual
Page 43
User guide
graphical formats (.bmp, .eps, .jpg, .png or .tif) using the
‘Save figure’ option on the ‘File’ menu and printed using the
‘Print figure’ option the ‘File’ menu. The figures are either
displayed in colour or in monochrome depending on the option
selected by the user within the ‘Options’ window. The options
used to create the figure can be changed within the ‘Options’
menu located at the top of the window.
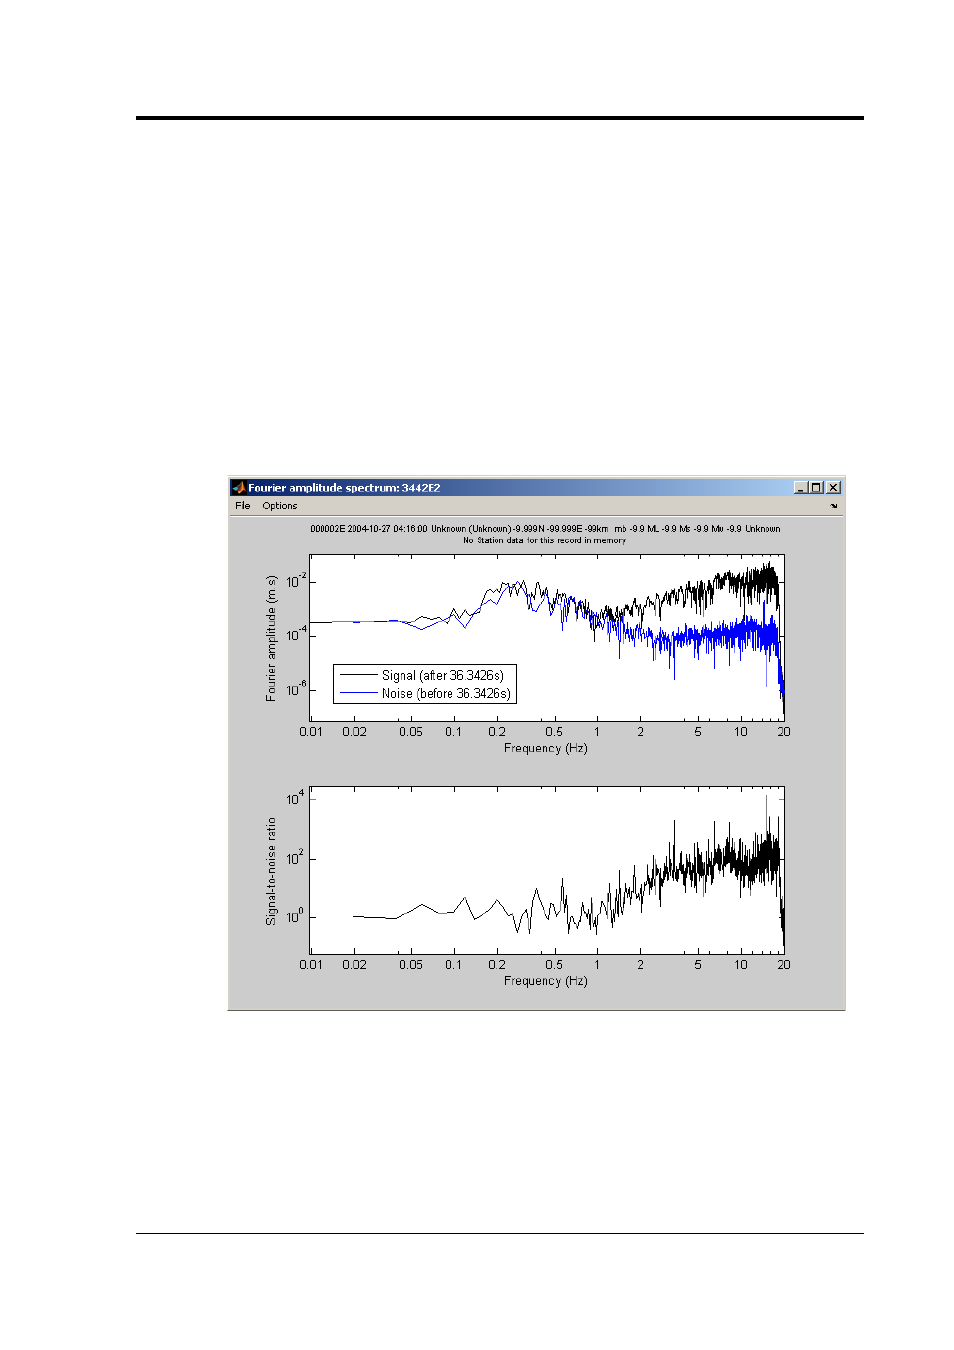
The Fourier amplitude spectra are displayed using units based
on the selected unit for the selected variable (e.g. a unit based
on the selected acceleration unit is used if the variable chosen
to be displayed is acceleration).
Single time-history selected
Clicking on this button when a single time-history has been
selected will calculate and display the Fourier amplitude
spectrum of the currently selected time-history. No smoothing
of the Fourier amplitude spectrum is applied. Two Fourier
amplitude spectra are calculated: one using the pre-event
portion of the record and one using the remainder of the
May 2009
43