Guralp Systems ART User Manual
Page 35

User guide
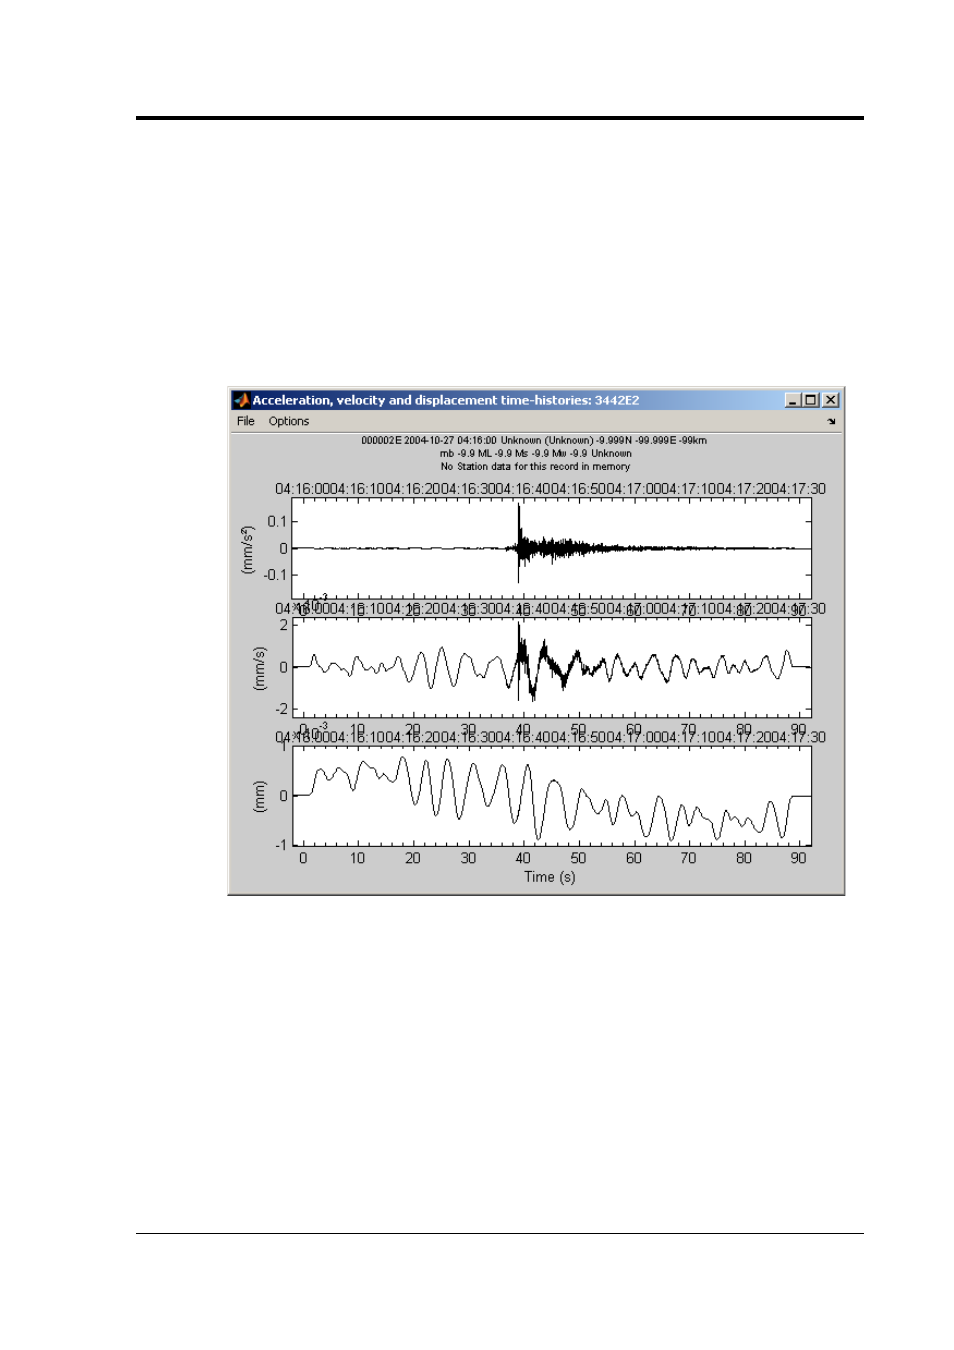
Also shown in this figure (if the ‘Display metadata’ option is
selected in the ‘Options’ window) are the basic earthquake,
waveform and station metadata of the selected time-history (if
available).
The user can zoom in on the three sub-figures by drawing a
bounding box or by clicking on the sub-figures (the sub-figures
are linked together so zooming in on one retains the correct
time relation between the three sub-figures). To zoom out
again, right-click.
At the top of this window there is a menu called ‘File’ with two
items: ‘Save figure’, which saves a copy of the window as a
graphics file (in .bmp, .eps, .jpg, .png or .tif format) and
‘Print figure’, which prints a copy of the window. In addition,
there is a menu called ‘Options’ that allows the user to modify
the variable plotted (acceleration, velocity or displacement),
the units used and whether to display grid lines on the figures.
Changes made here to these options are local and do not affect
the global options that can be modified in the Options window
discussed above.
May 2009
35
