Audioscan Verifit User Manual
Page 150
In addition to these well-controlled and repeatable
signals, live speech may be used as a test signal. It
will, of course, be unequalized and at an uncontrolled
level.
3
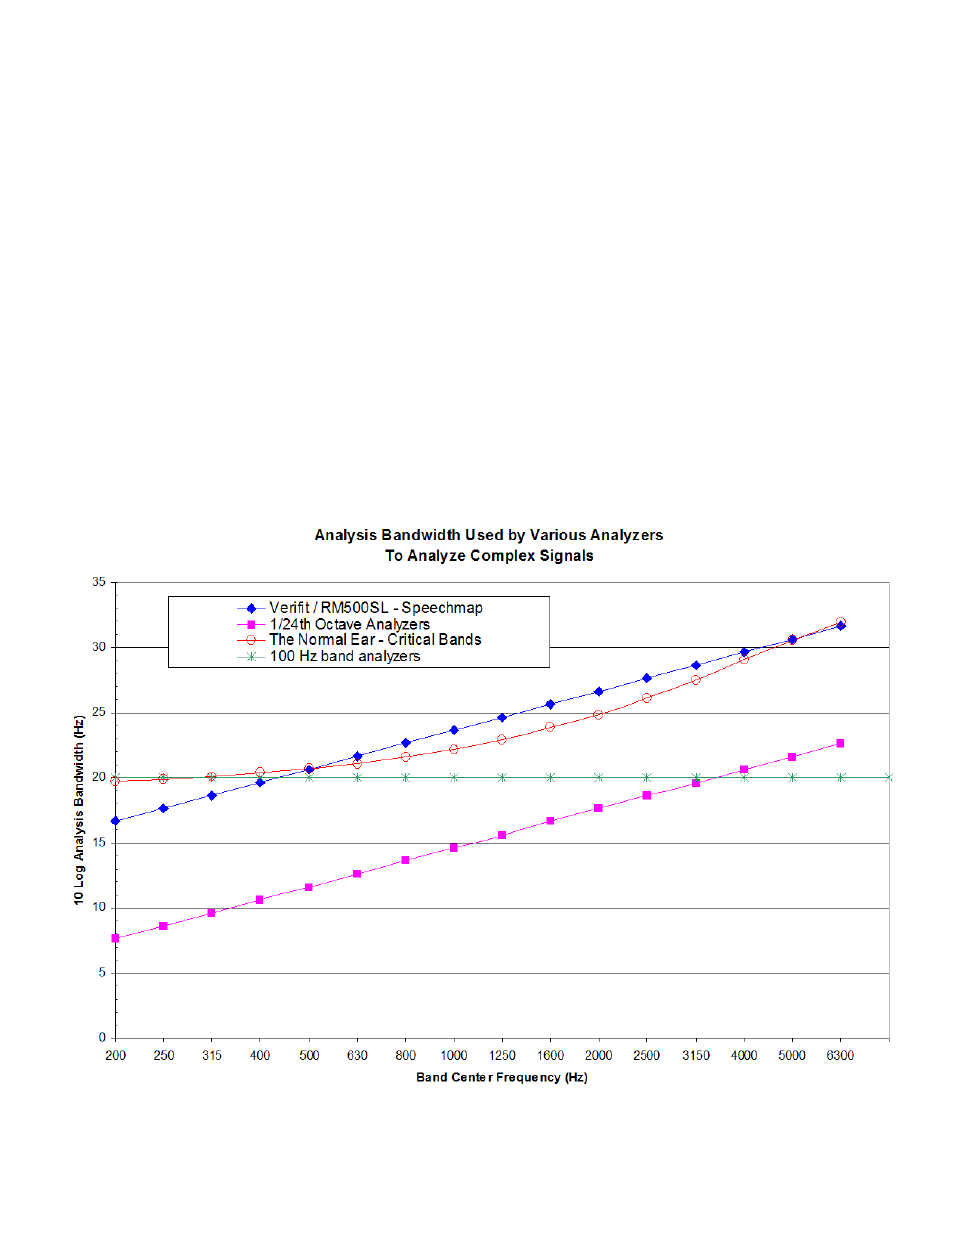
Analysis of broad-band signals
Broad-band signals contain energy at many frequen-
cies simultaneously. Such signals are usually analyzed
in a series of narrow frequency bands to produce a
spectrum. The auditory system functions on a loga-
rithmic frequency scale and analyzes broad-band sig-
nals in critical bands which approximate 1/3 octave
bands (Figure 7). Using 1/3 octave bands for analysis
of broad-band signals allows measured levels to be
compared more readily to narrow-band behavioral
measures, such as threshold. For this reason, analy-
sis of broad-band signals in all On-ear measurements
(including Speechmap Test box mode) is in 1/3 octave
bands. Other analyzers use narrower analysis bands,
sometimes having constant bandwidth. As shown in
Figure 7, this can result in significantly underestimat-
ing the audibility (or comfort or discomfort) of a com-
plex signal.
It should be noted that, in all On-ear measurements,
1/3 octave band SPL is displayed (and reported when
saving data to a file) at 1/12 octave frequencies which
provides curve smoothing and causes the spectrum
of narrow-band signals to appear broadened. When
calculating overall rms from these data, the SPL at 225
Hz and subsequent 1/3 octave increments should be
used.
Analysis of broad-band signals in all Test box tests,
except Speechmap, is in 1/12 octave bands and the
band SPL is displayed at 1/12 octave frequencies.
Figure 7: Analysis bandwidths of some real-ear analyzers and critical bands for a normal ear. If the analysis
bandwidth is less than a critical band, aided response curves shown to be at threshold (or UCL) will actually
be well above it.
7