Audioscan Verifit User Manual
Page 148
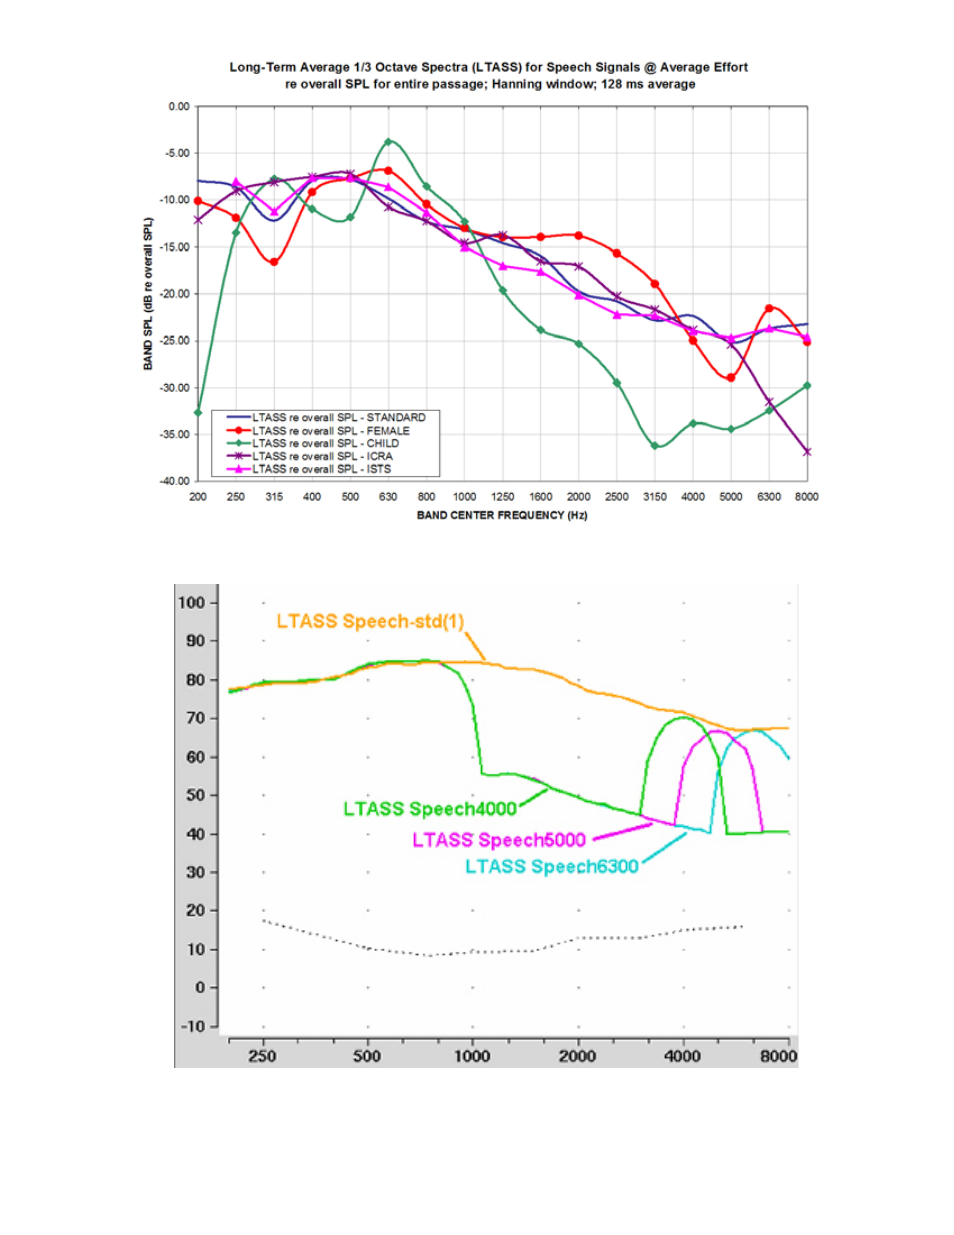
Figure 3: LTASS for Speechmap speech signals at average vocal effort
Figure 4: LTASS for Speech-std(1), Speech4000, Speech5000, Speech6300 for the FM boom location effects of Figure
6. Note that curves are 1/3 octave band levels at 1/12 octave intervals which causes the 1/3 octave bands at 4000,
5000 and 6300 Hz to appear broader than 1/3 octave. For clarity, the Speech3150 curve has been omitted.
5
09/01/29 © Etymonic Design Incorporated, 20 Ludwig St., Dorchester, ON, Canada N0L 1G4
USA 800-265-2093 519-268-3313 FAX 519-268-3256 www.audioscan.com
This manual is related to the following products: