2 horizontal fov vs. reading distance diagrams, 1 how to use the diagrams, Horizontal fov vs. reading distance diagrams – Datalogic Scanning Matrix 400 User Manual
Page 104: How to use the diagrams, See par. 7.2 for fov vs
MATRIX 400™ REFERENCE MANUAL
94
7
Example:
The FOV for a Matrix 400 600-0x0 base using the 16 mm lens at a focus distance of 200
mm is:
FOV
H
= 2 [(200 mm + 35 mm) tan (24°/2)] = 100 mm
FOV
V
= 2 [(200 mm + 35 mm) tan (18°/2)] = 74 mm
7.2 HORIZONTAL FOV VS. READING DISTANCE DIAGRAMS
The following graphs represent the Horizontal Field of View (FOV) and Reading Distance
based on the combination of a certain sensor (Matrix 400™ base model) and a certain lens.
Each point represents the maximum achievable Field of View with the selected code
resolution (in this point DOF is limited).
NOTE
The following diagrams are given for typical performance at 25°C using
high quality grade A symbols according to ISO/IEC 15416 (1D code) and
ISO/IEC 15415 (2D code) print quality test specifications. Testing should
be performed with actual application codes in order to maximize the
application performance.
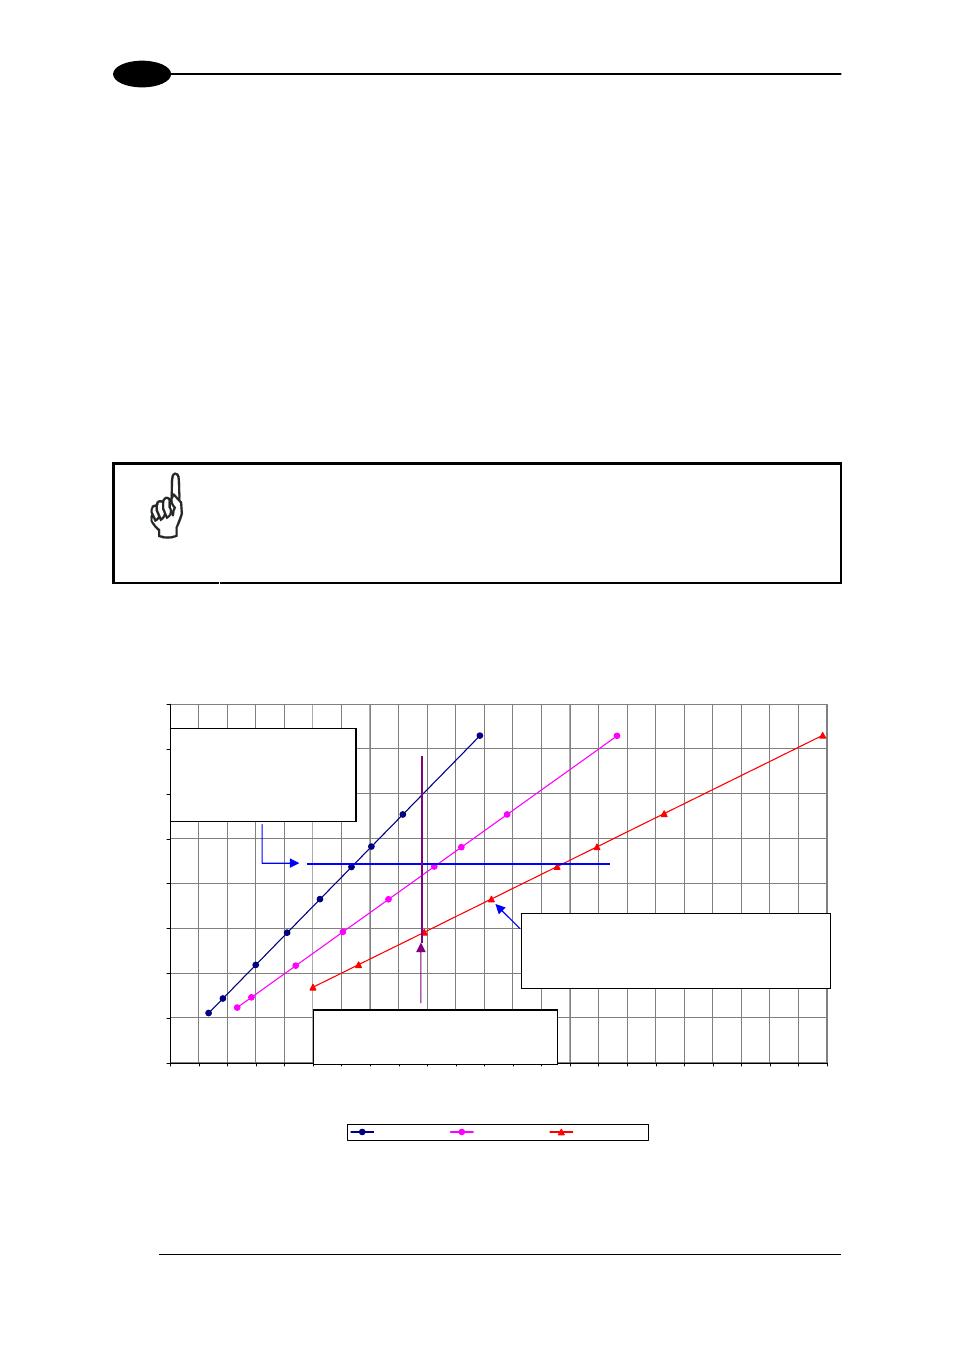
7.2.1 How to Use the Diagrams
0
5
10
15
20
25
30
35
40
0
10
20
30
40
50
60
70
80
90
100 110 120 130 140 150 160 170 180 190 200 210 220 230
Reading Distance (cm)
Hor
izontal FOV (cm)
SXGA - 25 mm
SXGA - 35 mm
SXGA - 50 mm
0.25
0.20
0.20
0.25
0.30
0.33
0.38
0.25
0.50
0.30
0.33
0.38
0.38
0.50
0.50
0.33
0.30
0.15
0.10
0.15
0.10
0.20
0.15
For a given code resolution,
the blue line represents the
maximum Horizontal FOV.
The reading distance can be
selected by changing the lens.
For a given Reading Distance you must
select the lens that is able to read your
code resolution.
Each point represents the maximum FOV for a given
code resolution.
You can read this resolution code with the same
lens at shorter distances but sacrificing FOV.