Test results, Test phase, Graph styles – Welch Allyn OAE Hearing Screener - User Manual User Manual
Page 35: Snr bar graph view
Test results
Test phase
The screener automatically performs a calibration at the start of each test. During
calibration a series of tones are sent to the ear canal to calibrate the levels of the
frequencies to be tested. Following calibration of the test tones, the test phase begins
automatically.
Note
Press the UP control panel button to abort a test in progress. No record of
an aborted test is saved in memory.
Graph styles
The results of a test are displayed as a graph. The graph is generated and shown during
the test and can be viewed after the test is complete.
There are two graph options for viewing the results:
•
The default view is a signal-to-ratio (SNR) bar graph. It displays the SNR for each DP
test frequency.
•
The value graph view displays the absolute emission and noise levels for each DP
test frequency.
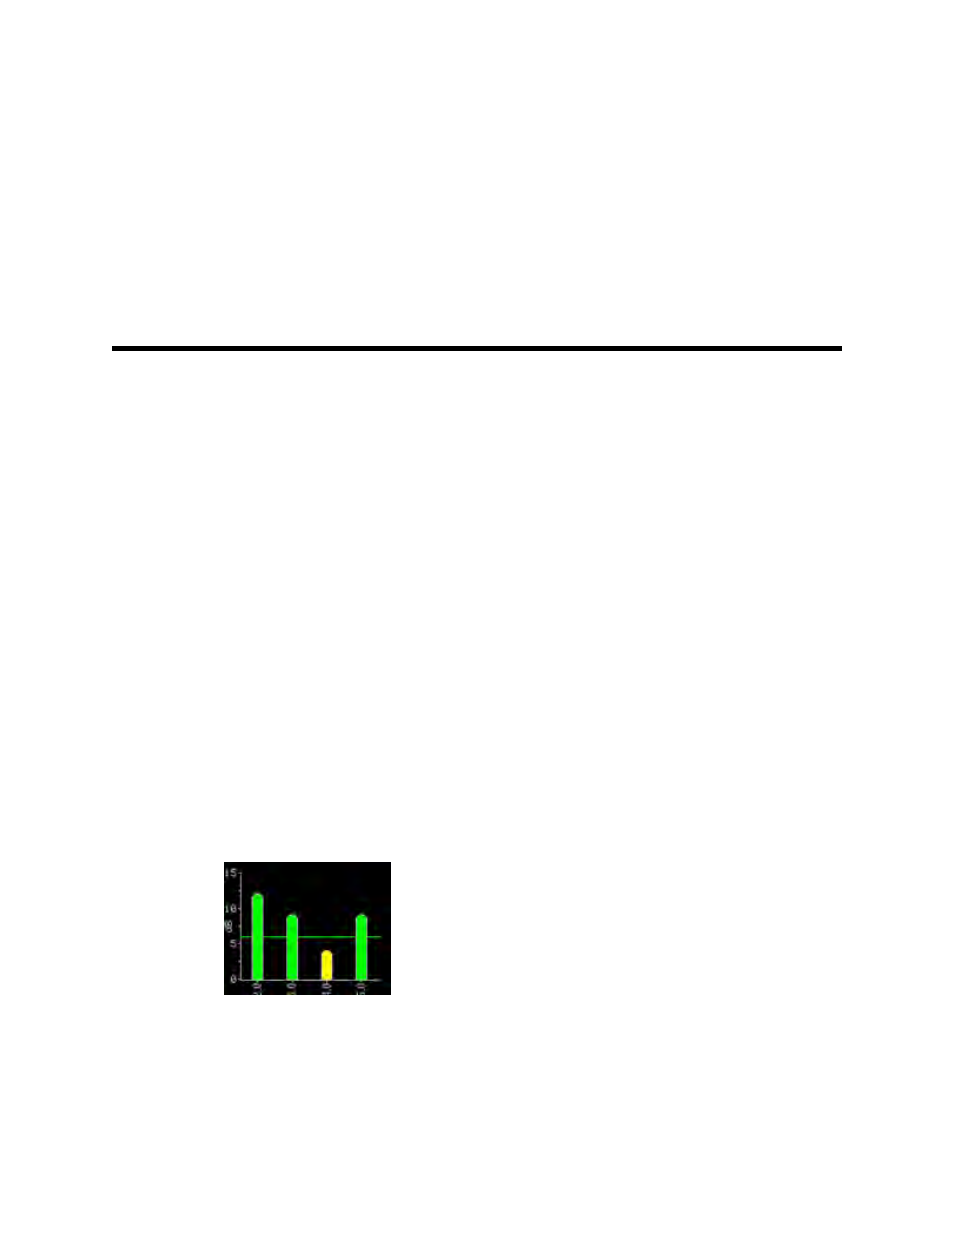
SNR bar graph view
The default SNR bar graph view displays the emissions and noise floor (NF) as they are
measured. Each column represents one DP test frequency. The height of each column
represents the SNR being measured.
The horizontal green line at the decibel level corresponding to the SNR indicates the level
required for a PASS. A green bar indicates a PASS and a yellow bar indicates a REFER.
See “Change graph style” for instructions on how to switch the graph views between
SNR bar graph and value graph.
31