Standard curve – Bio-Rad Image Lab™ Software User Manual
Page 124
5 | Viewing Images
124 | ChemiDoc MP Imaging System with Image Lab Software
Standard Curve
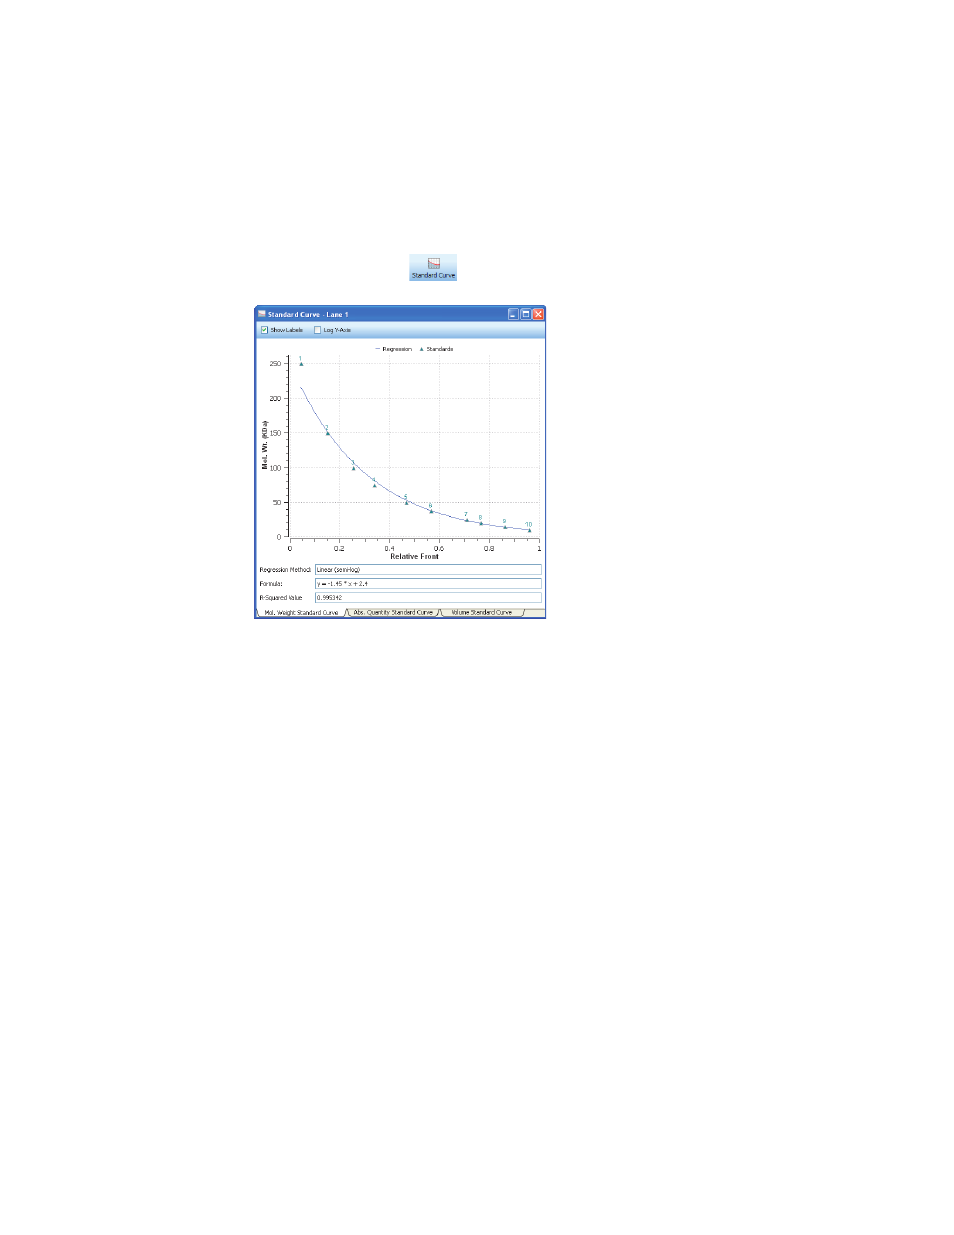
The Standard Curve dialog box displays the best curve fit for the defined standards
and the bands relative to this curve for the lane selected in the image. The tabs at
the bottom of the dialog box display the standard curves for three different
analyses.
Standards appear in green. Unknown bands appear in red. You can toggle the
molecular weight display on the y-axis between linear and log scale by clicking the
Log y-axis box at the upper left. The regression method you chose in Molecular
Weight Analysis Tools appears, as well as the formula (if applicable) and the R
2
value
of the regression method.
Tabs in this window enable you to view the molecular weight standard curve, the
absolute quantity standard curve, or the volume standard curve.