Interpreting the measurement – Bird Technologies SK-4000-TC-Manual User Manual
Page 25
13
Figure
7
Tracing Setting Screen
Figure3.6 Tracing Setting Screen
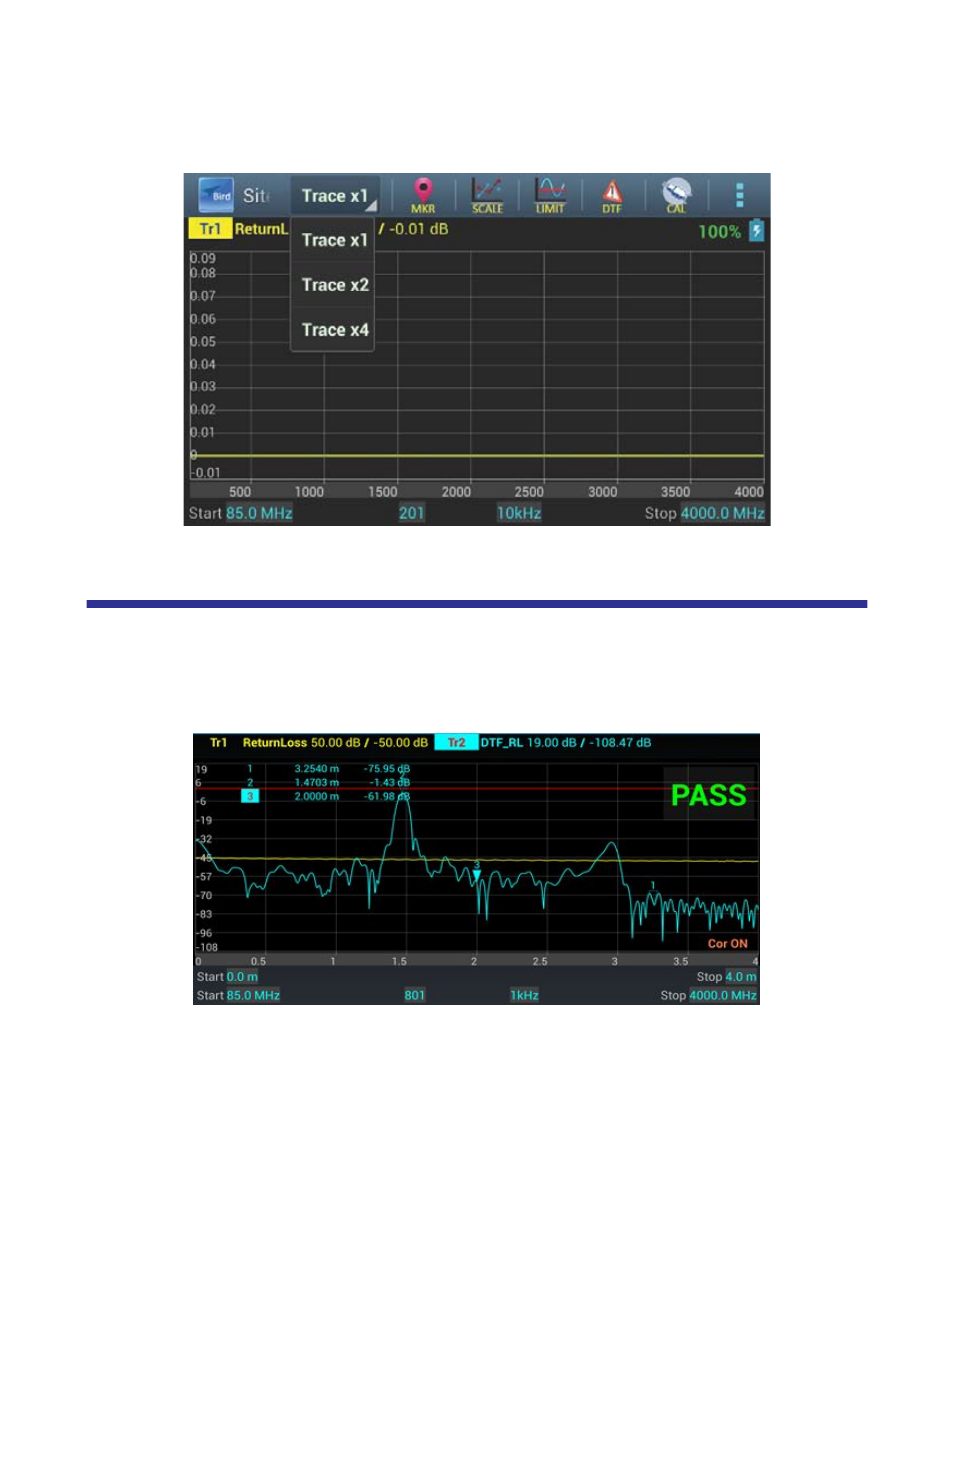
Interpreting the Measurement
The graph below shows a typical Match Measurement for an antenna system.
Figure
8
Graph
The graph contains the following elements:
Trajectory of vertical axis vertical grid scale display activity data values.
Horizontal grid scale display incentive axis data values (frequency, time
or distance).
Baseline position on behalf of the reference trajectory position.
The measured value of the cursor on behalf of the activity on the tra-
jectory difference.
Track number is used to locate in a window.
When scanning duration of more than 1 second, the current incentive
position indicator will appear.
See also other documents in the category Bird Technologies Accessories communication:
- SK-4000-TC-Datasheet (2 pages)
- SH-36S-Manual (206 pages)
- SH-36S-Datasheet (4 pages)
- SH-36S-PC-Manual (130 pages)
- SH-36S-PC-Datasheet (2 pages)
- SH-36S-PC-Quick Start (2 pages)
- SH-36S-RM-Datasheet (2 pages)
- SA-3600XT-Manual (112 pages)
- SA-3600XT-Datasheet (2 pages)
- AT-500-Manual (73 pages)
- AT-500-Datasheet (2 pages)
- AT-800-Manual (74 pages)
- 89-83F-02-03-Manual (2 pages)
- 89-83F-02-03-Datasheet (1 page)
- 8251 Series-Datasheet (1 page)
- 8251 Series-Manual (30 pages)
- DA10 VHF Series-Datasheet (2 pages)
- DA10 VHF Series-Manual (47 pages)
- 8865SC13-Datasheet (2 pages)
- 8865SC13-Manual (28 pages)
- 8890-300SC13-Manual (28 pages)
- 8921SC13-Manual (28 pages)
- 8931-115SC13-Manual (34 pages)
- BDS-Datasheet (2 pages)
- BDS-Manual (98 pages)
- SCC7 Series-Datasheet (2 pages)
- SCC7 Series-Manual (45 pages)
- MSCC7 Series-Datasheet (2 pages)
- MSCC7 Series-Manual (35 pages)
- SCC8 Series-Datasheet (2 pages)
- SCC8 Series-Manual (47 pages)
- 4020 Series-Datasheet (1 page)
- 4020 Series-Manual (4 pages)
- 4027A Series-Datasheet (2 pages)
- 4027A Series-Manual (6 pages)
- 4027F Series-Datasheet (2 pages)
- 4027F Series-Manual (6 pages)
- 4028 Series-Datasheet (2 pages)
- 4028 Series-Manual (6 pages)
- 7022-Datasheet (4 pages)
- 7022-Manual (27 pages)
- ACM Series-Datasheet (2 pages)
- ACM Series-Manual (40 pages)
- BPME Series-Datasheet (4 pages)