Chapter 6: history – Sensaphone WSG30 System Users manual User Manual
Page 27

Chapter 6: History
27
ChAptER 6: hiStoRY
This chapter explains how to query the Event and Data Log History. The Event Log is a time-stamped
list of system events such as System Startup, Alarm Detection, Message Delivery, … The Data Log
contains time stamped records of the input values. The logging rate is configured on the Sensor pro-
gramming screen for each input. The query results can be viewed on screen within your browser or they
can be exported to other file formats (TXT, CSV, XML) for use within other programs, such as Excel. To
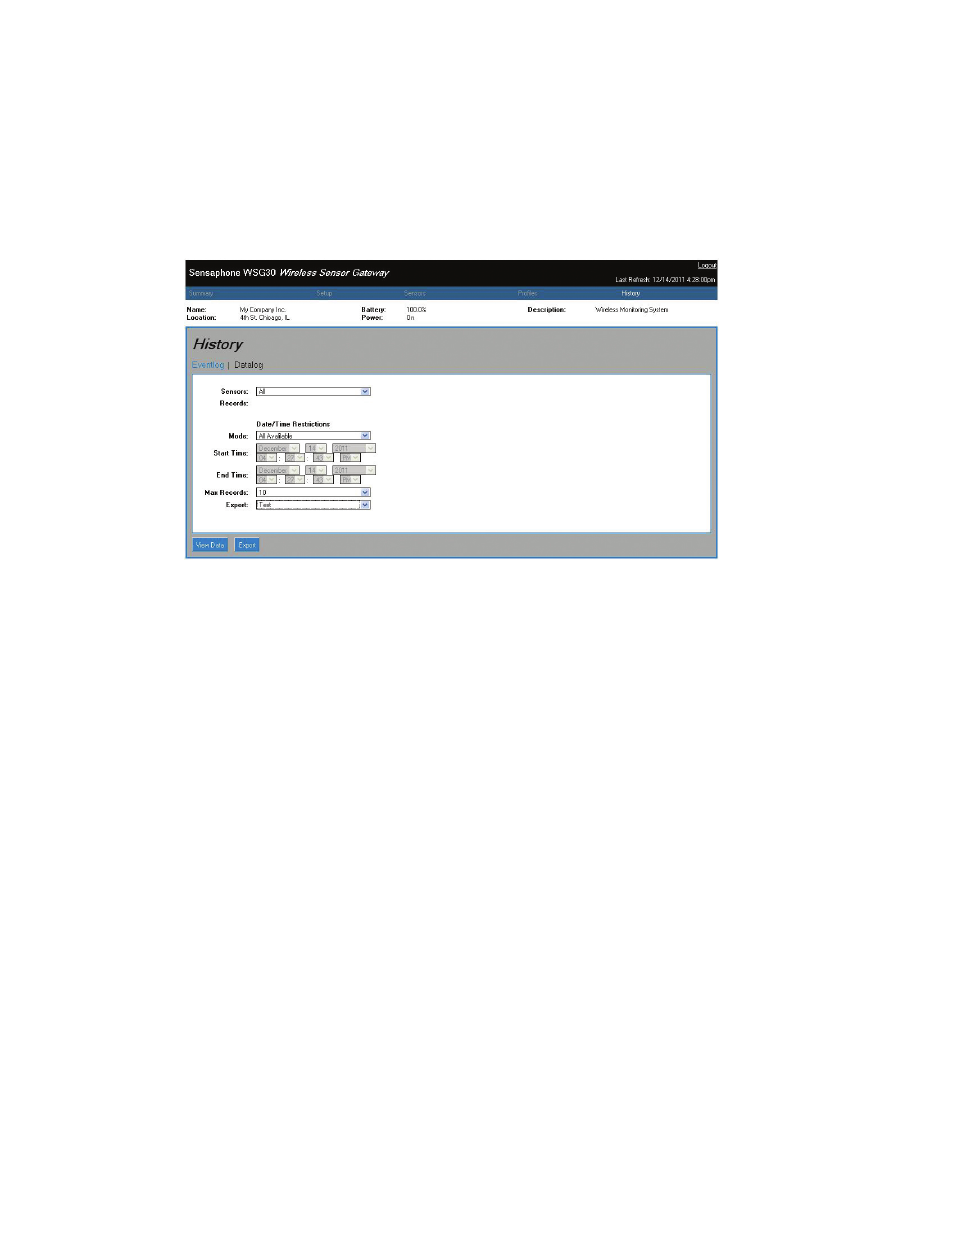
begin, click on History from the menu bar. The following screen will appear:
Fig 1: History Screen
EvEnt log quERy
Select Event Log from the top of the screen. Select a particular Sensor to narrow your query results
to events associated with a particular sensor or choose All to see all event types in the Event Log. You
can narrow the results from a particular time period by selecting the Mode drop-down. This gives
you options to choose events from the Previous 24 Hours, the Last 7 days, the Current Month or you
can select a Custom time period. When you choose Custom, the Start Time and End Time fields will
become active. Enter the start and end times for your query. Next, choose the maximum number of
records you want returned for your query, the choices are 25, 50, 100 and All. Finally, click the View
Data button to display the results. Alternatively you can Export the results to a file for viewing in
another program. Choose the Export file format from the drop-down list (XML, CSV, TXT) and click
the Export button to create a file.
datalog quERy
Select Data Log from the top of the screen. Select a particular Sensor to narrow your query results to a
particular sensor or choose All to see samples from all sensors. Next, choose whether you’d like to view
All samples, all Normal samples, or specifically samples that exceeded the alarm limits. You can narrow
the results from a particular time period by selecting the Mode drop-down. This gives you options
to choose events from the Previous 24 Hours, the Last 7 days, the Current Month or you can select
a Custom time period. When you choose Custom, the Start Time and End Time fields will become
active. Enter the start and end times for your query. Next, choose the maximum number of records you
want returned for your query, the choices are 25, 50, 100 and All. Finally, click the View Data button
to display the results. Alternatively you can Export the results to a file for viewing in another program.
Choose the Export file format from the drop-down list (XML, CSV, TXT) and click the Export button to
create a file.
