RKI Instruments GX-2009 Data Logger Management Program User Manual
Page 51
Viewing, Printing, Exporting, and Deleting Data in the Data Window • 51
•
For any event, the data point before and after the event is
always shown.
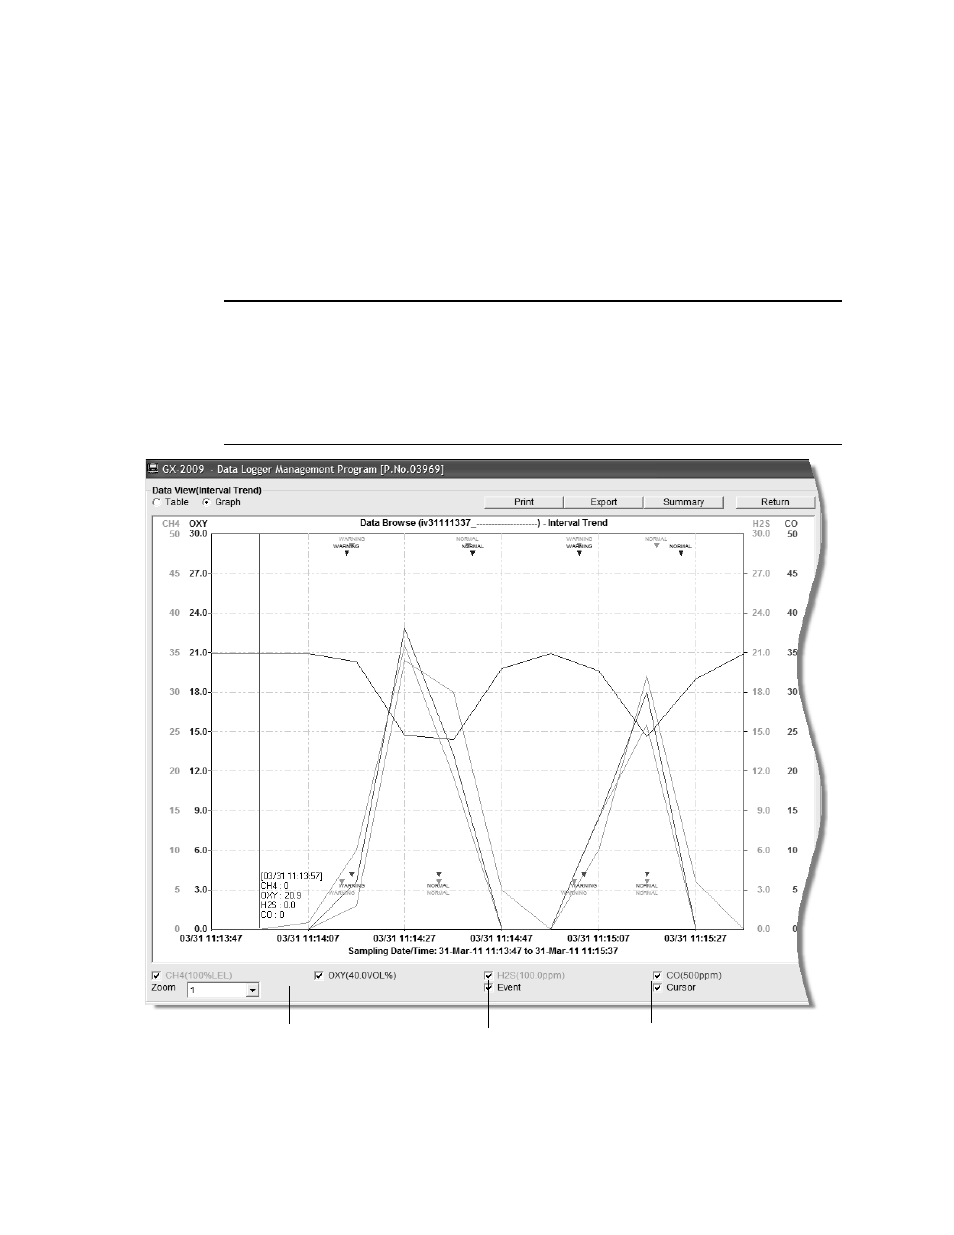
11.To view the data in graph format, click the Graph selection
button. Five or more scheduled data points are required in
an interval trend data file to be able to display it in graph
format.
NOTE: The data count shown when you have selected an
interval trend data file, as in Figure 31 above, can be
more than five if you have events, such as the GX-2009
going into and out of alarm, but you may not have five
scheduled data points.
Figure 35: Interval Trend Data in Graph Format
Cursor feature
Zoom level
Event select