ElmoMC SimplIQ Digital Servo Drives-Bell Getting Started User Manual
Page 84
The SimplIQ for Steppers Getting Started & Tuning and Commissioning Guide
MAN-BELGS (Ver. 1.1)
84
Comparing (6) and (2), we find that the Laplace variable
s
is equivalent to the
derivative operator,
dt
d
s
⇔
and its inverse to an integrator,
∫
⇔
t
d
s
τ
1
.
The
transfer function that relates the torque of a motor to its position is roughly a
double integral (the torque is roughly proportional to acceleration), so that the
transfer function from the motor torque to its position is roughly
2
1
s
J
m
where
m
J
is the motor inertia.
Please note that the transfer function is a full description of the response of its
related system to any input, not just to sinusoids.
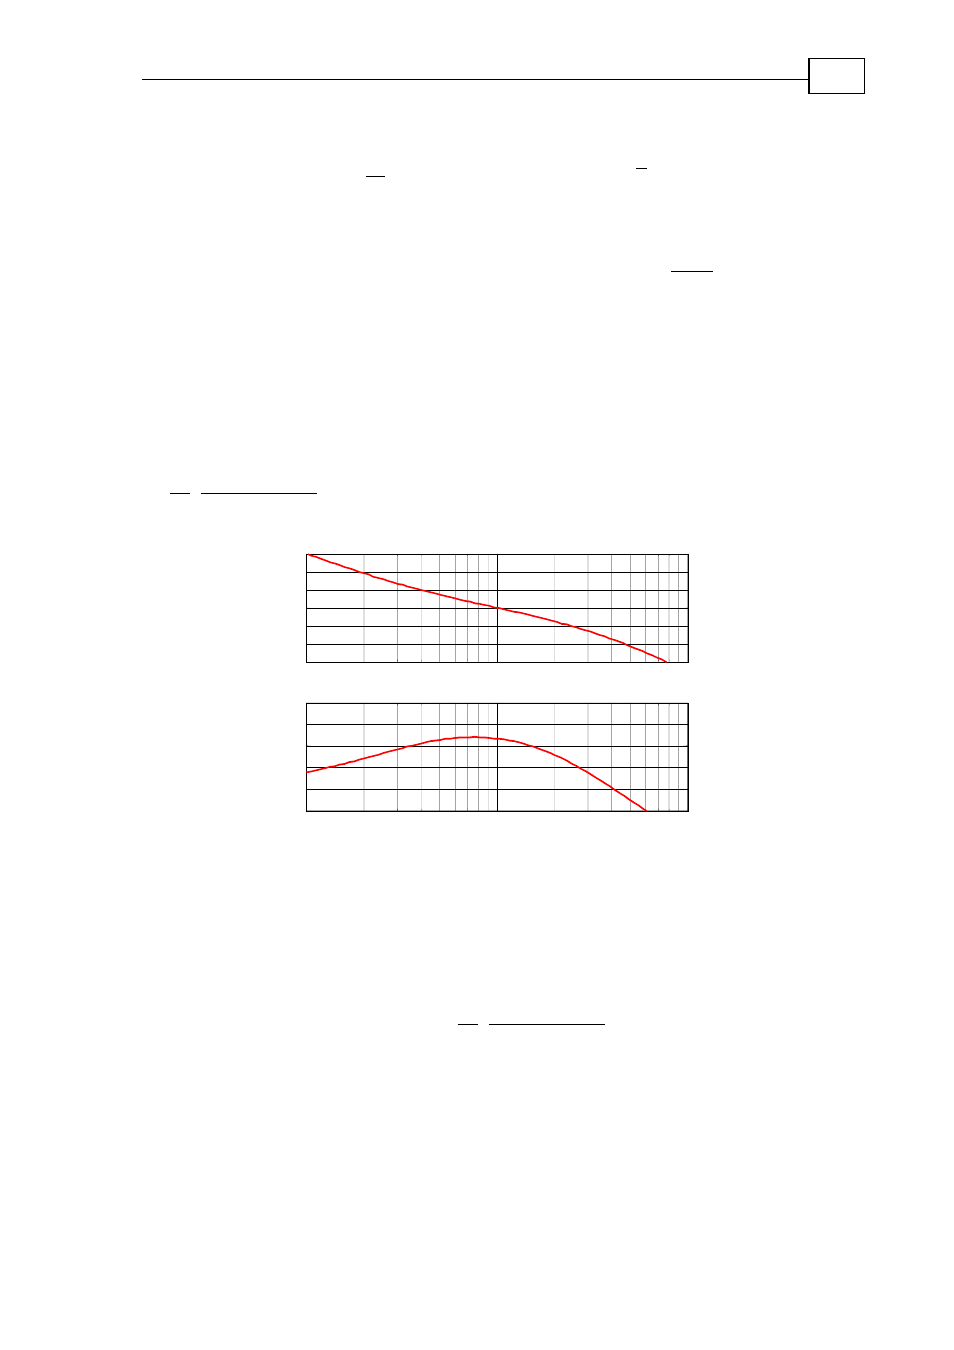
It is customary to describe the frequency response of a system pictorially by a
plot of the amplitude and phase of (6) versus the frequency
ω
where
ω
= j
s
, this
plot is known as its Bode plot. A Bode plot example for the function
(
)
(
)(
)
33
60
3
2000
10
2
+
+
+
⋅
s
s
s
s
is given in Figure 75.
10
0
10
1
10
2
-30
-20
-10
0
10
20
30
dB
10
0
10
1
10
2
-200
-180
-160
-140
-120
-100
deg
log(
ω)
Figure 75: Bode plot of a function
Another efficient pictorial representation of a linear system is the Nichols plot.
The Nichols plot is a plot of the amplitude of (6) versus its phase along the real
parameter,
ω
, where
ω
j
s
=
. The Nichols plot of the same transfer function is
shown in Figure 76. As will be shown in the next plot, the Nichols plot is a very
attractive description of an LTI system for feedback control design. An example
Nichols chart of the transfer function
(
)
(
)(
)
33
60
3
2000
10
2
+
+
+
⋅
s
s
s
s
is in the figure below.