ElmoMC SimplIQ Digital Servo Drives-Bell Getting Started User Manual
Page 68
The SimplIQ for Steppers Getting Started & Tuning and Commissioning Guide
MAN-BELGS (Ver. 1.1)
68
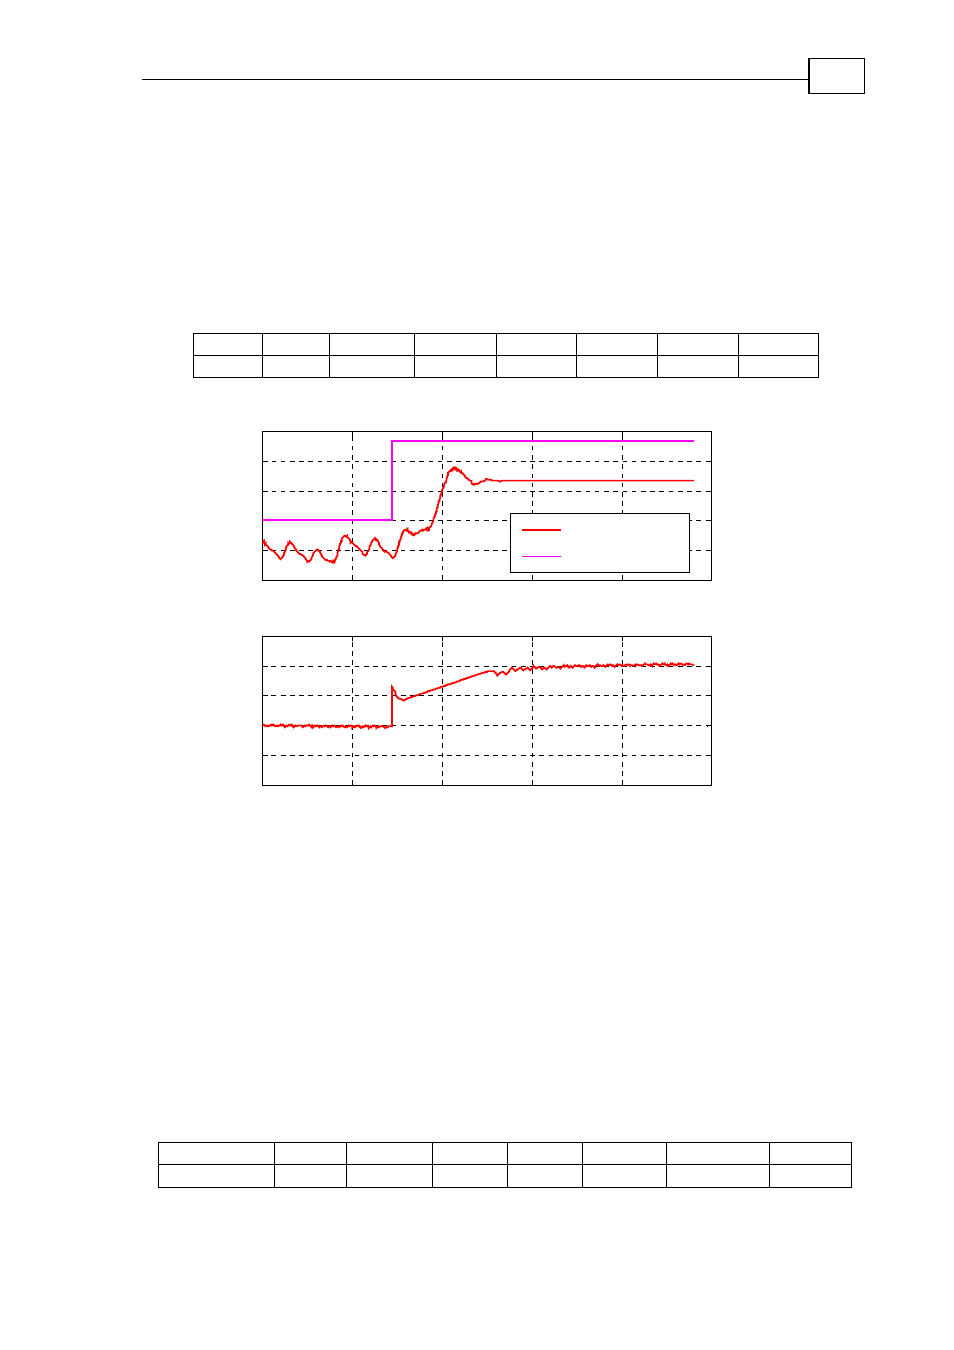
Figure 59 reveals the following:
1. The measured output does not reach the commanded step.
2. Current command is far from saturation, therefore you can increase the
velocity command.
Figure 60 repeats the same test with increased velocity and test duration as given
in the table below. Note that there is a long time duration (from 0.7 to 1.3 sec.)
that the velocity is almost fixed while the current increases, this is a result of high
friction.
KP
KI
Velocity +Displ.
-Displ.
Rec. T.
Rec. Res Profile
1
3
48000
20000
20000
2.4 sec
2 msec
Off
0
0.1
0.2
0.3
0.4
0.5
-3
-2.1
-1.2
-0.3
0.6
1.5
x 10
4
Tim e (sec.)
C
oun
ts
/s
e
c
.
Speed
R eference
0
0.5
1
1.5
2
2.5
-0.3
-0.2
-0.1
0
0.1
0.2
Am
p
e
re
Tim e (sec.)
Figure 60: A test with the same controller as the test of Figure 59 with a higher velocity
command and a longer recording time (Speed2)
1. Repeat step 1, increasing KI and KP simultaneously by 50% at a time until one
of the following occurs:
The step response exhibits an overshoot of about 20%.
The step response is unacceptable for any reason, for example any sign of
resonant oscillation.
The system exhibits large overshoot and undershoot which is a sign of being
close to instability. In this case decrease KP by at least a factor of 2.0.
The final response is in Figure 61, which includes several tests based on increasing
KI and KP with the values given in the following table
KP
KI
Velocity +Displ. -Displ. Rec. T.
Rec. Res
Profile
10,20,30,40
6 KP
π
12000
5000
5000
0.48 sec
400 usec
Off