Processor states – HP Integrated Lights-Out User Manual
Page 121
Using iLO 2 121
•
Present Power Cap displays the current power cap setting.
The 24-Hour History section displays the following:
•
Average Power Reading displays the average of the power readings from the server over the last 24-
hour period. If the server has not been running for 24 hours, the value is the average of all the
readings since the server was booted.
•
Maximum Power displays the maximum power reading from the server over the last 24-hour period.
If the server has not been running for 24 hours, the value is the maximum of all the readings since
the server was booted.
•
Minimum Power displays the minimum power reading from the server over the last 24-hour period. If
the server has not been running for 24 hours, the value is the minimum of all the readings since the
server was booted.
•
Show value in BTUs changes the displayed data from watts to BTUs.
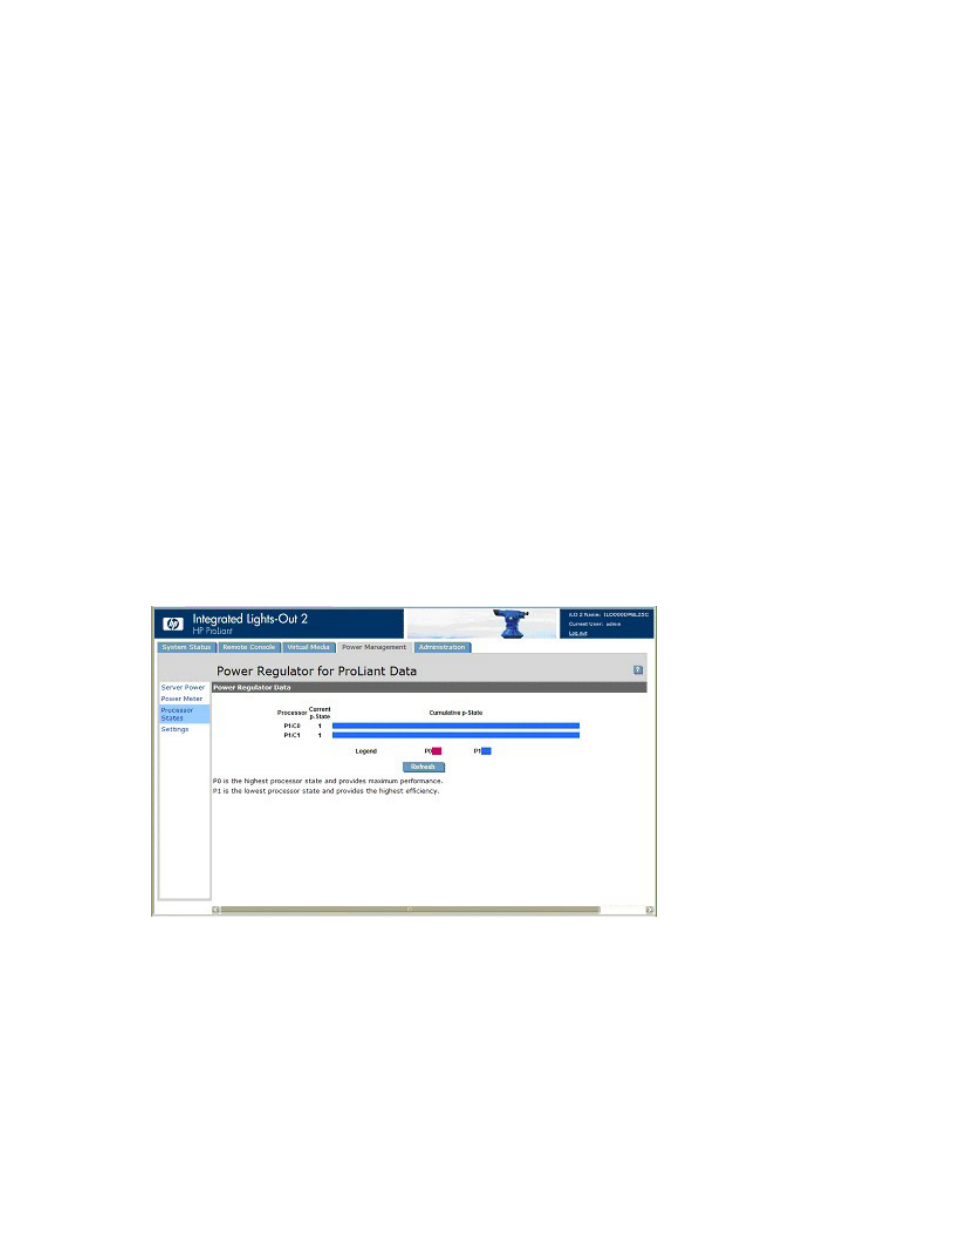
Processor states
The Power Regulator for ProLiant Data page enables you to view processor states (p-state) and a running
average of the percentage of time each logical processor has spent in each p-state over the previous 24-
hours. Click Refresh to update the p-state data graph.
You must have the Configure iLO 2 Settings privilege to view the Power Regulator for ProLiant Data page.
Power Regulator for ProLiant Data is a licensed feature available with the purchase of optional licenses.
For more information, see "Licensing (on page
)".
To access the Power Regulator for ProLiant Data page, click Power Management>Processor States.
The Power Regulator Data page displays the collected p-state data, starting from host power up once a
second and then refreshes for display once every 5 minutes. The system ROM reads the current status of
each logical processor. The status register in Intel®-based platforms reflects the current operating
frequency and voltage. Because of multiple processor dependencies, the status might or might not reflect
an absolute p-state. The frequency might be at one p-state and the voltage at a higher p-state. The system
ROM updates the p-state count of the p-state for the current frequency and not the current voltage.
Data is displayed using a bar graph, with the total bar length representing 100% of the time covered by
the data. One data graph is displayed for each processor or core. Data graphs for multiple threads on a
processor or core that supports Hyper-Threading are not displayed. A portion of the bar is colored