Platform event filtering configuration – HP Lights-Out 100 Remote Management User Manual
Page 33

Using LO100 33
2.
On ProLiant ML150 G2 servers:
a.
To navigate to the Monitor menu, press the right arrow (
→
) key.
b.
Scroll down to view the different sensors. Data is real-time and updated periodically.
3.
On ProLiant DL140 G2 and ProLiant DL145 G2 servers:
a.
Press the right arrow (
→
) key to navigate to the Advanced menu.
b.
Press the down arrow (
↓
) key to scroll to IPMI. Press the Enter key.
c.
Press the down arrow (
↓
) key to scroll to Realtime Sensor Data. Press the Enter key.
The
Loading data. Please wait…
message appears. After this message disappears, the
Temperature and Voltage sensor data appears. Data is displayed in real-time and updated
periodically.
4.
On the ProLiant ML110 G3 server:
a.
Press the right arrow (
→
) key to navigate to the Advanced menu.
b.
Press the down arrow (
↓
) key to scroll to Hardware Health Configuration menu. Press the Enter
key. The real-time sensor data displays.
Platform event filtering configuration
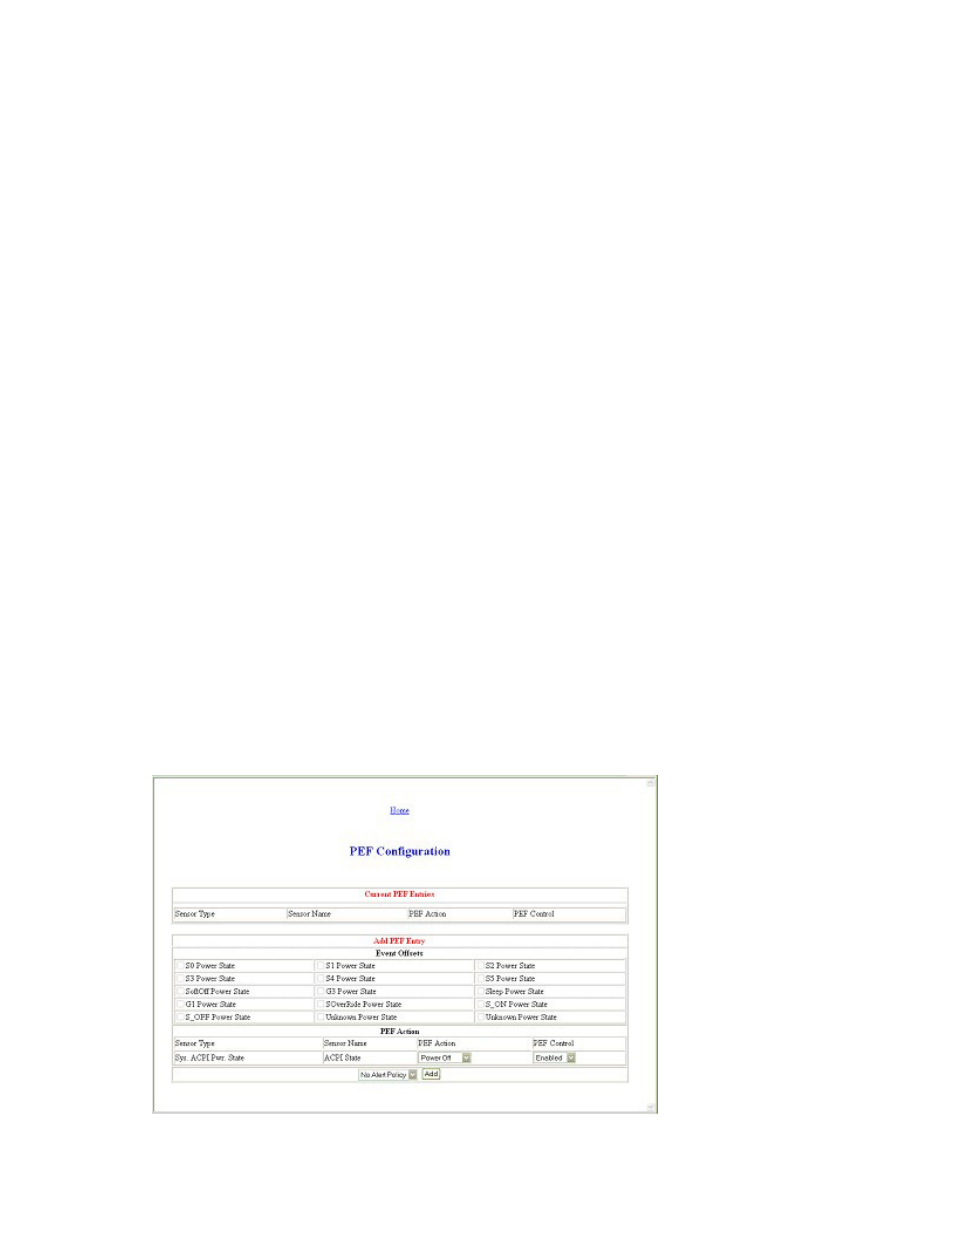
The PEF Configuration screen enables you to configure LO100 to take selected actions on received or
internally generated event messages. These actions include powering down the system, system reset, and
triggering the generation of an alert.
To configure a PEF for a particular sensor, click the PEF button to the far right of that sensor on the
Monitoring Sensors screen. The PEF button adjacent to each sensor opens a PEF Configuration page for
that sensor.
The PEF Configuration screen contains two sections: Current PEF Entries and Add PEF Entry. The Current
PEF Entries section includes Sensor Type, Sensor Name, PEF Action, and PEF Control information. The
Add PEF Entry section enables you set an action.
Initially, there are no entries in the Current PEF Entries section because no PEFs are defined. When PEF
entries are defined, the PEF Control field is active and allows individual entries to be enabled, disabled,
or deleted.
