Milestone Analytics 2.2 Dacolian LPR User Manual
Page 34
Milestone XProtect Analytics 2.2 – Dacolian LPR; Administrator’s Manual
www.milestonesys.com
Page 34
Event Mapping Tool
This method can also be used for sending data about analytics detections to additional hosts, such
as the Event Proxy Tool which lets you combine analytics detections in order to present them as
one combined detection to users in the Smart Client. Read more in step 5 in the following.
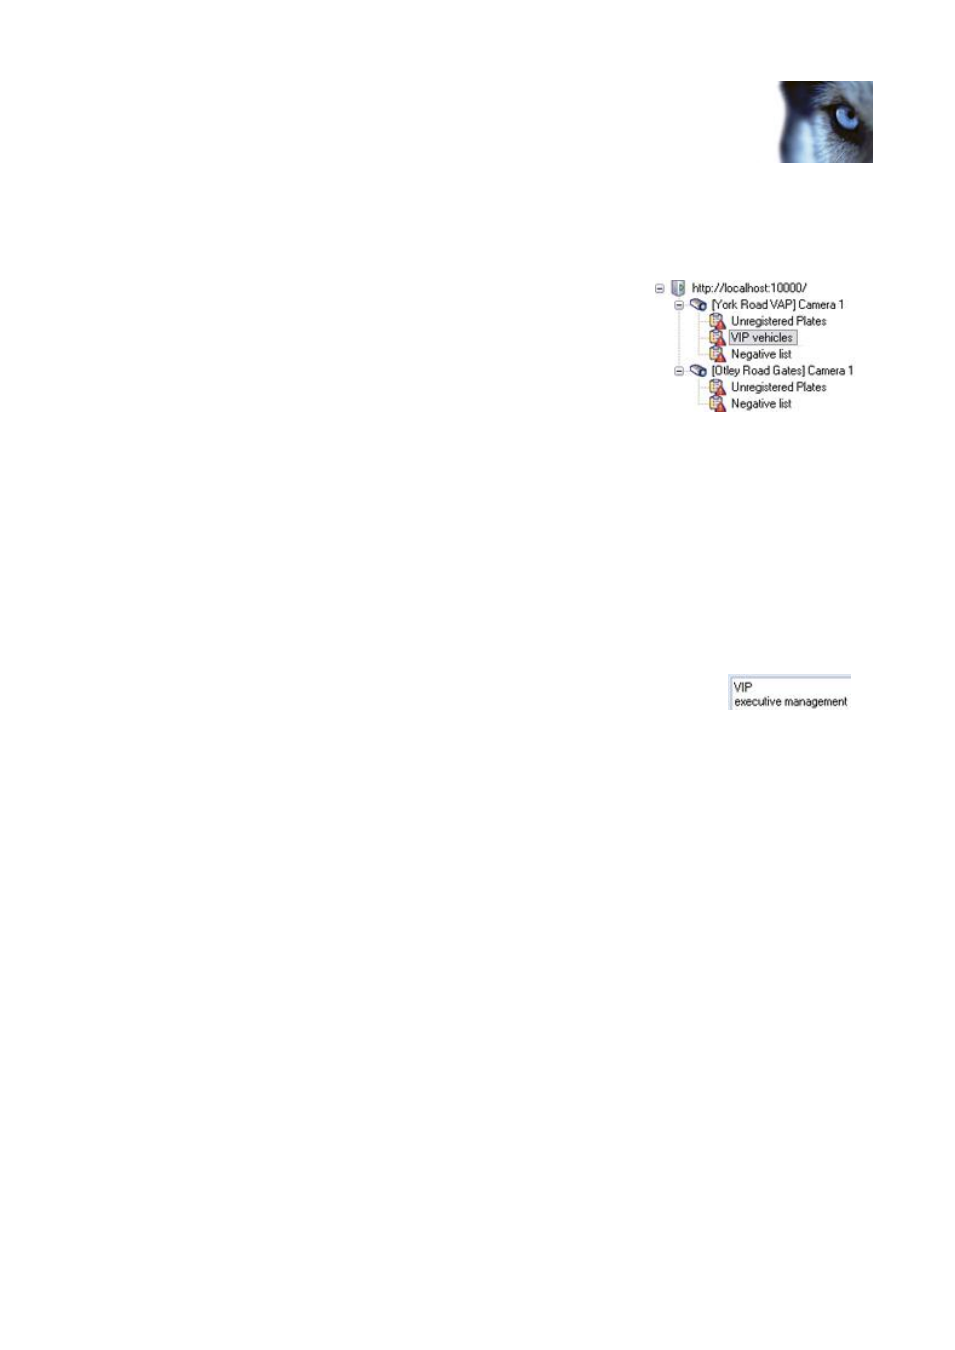
1. In the expandable list in the left side of the Event Mapping Tool, select the required
analytics detection.
Depending on your type of analytics, the required analytics
detection may be a rule (such as the detection of a person
crossing a line, an illegally parked vehicle, a left object, etc.)
or a list (used in, for example, license plate recognition
where particular license plates may be on positive or
negative lists).
In the example, from we have selected a list of VIP vehicle
license plates.
2. In the Generic Events section's Available events list, either ...
Select Send alert text as event. This will send the entire analytics detection alert
text in the data packet which the surveillance server will analyze in order to trigger
the generic event. If using this option, you must be sure that the alert text contains
the data matching the requirements of the generic event configuration on the
surveillance server.
- or -
Use the Event text field to type the phrases or numbers required to trigger the
generic event. If more than phrase or number can be used for
triggering the generic event, type them on separate lines
(press your keyboard's ENTER key for a new line). Example:
3. In the Server generic event port field, specify the port number on which the surveillance
server listens for generic event data. By default the port number is 1234. However, if the
port number has been changed on the surveillance server, make sure you match the
change in the Event Mapping Tool.
To verify which port is used for generic events on the surveillance server, open the
surveillance server's Administrator application, click the I/O Setup button, then the
Advanced... button, and look for the port number in the Alert Port field.
4. Select the protocol on which the surveillance server listens for generic event data, either
TCP or UDP. Again, your selection must match what has been specified for the required
generic event on the surveillance server.
5. Optionally, you are able to send the data defined in step 2 to an additional host.
FAQ: Why would I want to use an additional host? Sending data about analytics
detections to an additional host can be interesting in several scenarios, depending on your
organization's needs. For example if you want to combine two or more analytics detections
in order to present them as one combined detection to users in the Smart Client. To
combine analytics detections you use the Event Proxy Tool, accessed by double-clicking the
file VideoOS.EventProxy.ProxySetup.exe in the XProtect Analytics installation folder, which
also contains documentation for the Event Proxy Tool. If using the Event Proxy Tool to
combine analytics detections, you would use the Event Mapping Tool's Additional host fields
to specify the address, port and protocol on which the Event Proxy Tool listens for input.
Specify the address of the additional host in the Additional output host field, the required
port number in the Additional output port field, and the required protocol in the Additional