5 hydrograph menu – KROHNE OPTISENS PAM 2080 EN User Manual
Page 42
www.krohne.com
42
6.5 Hydrograph Menu
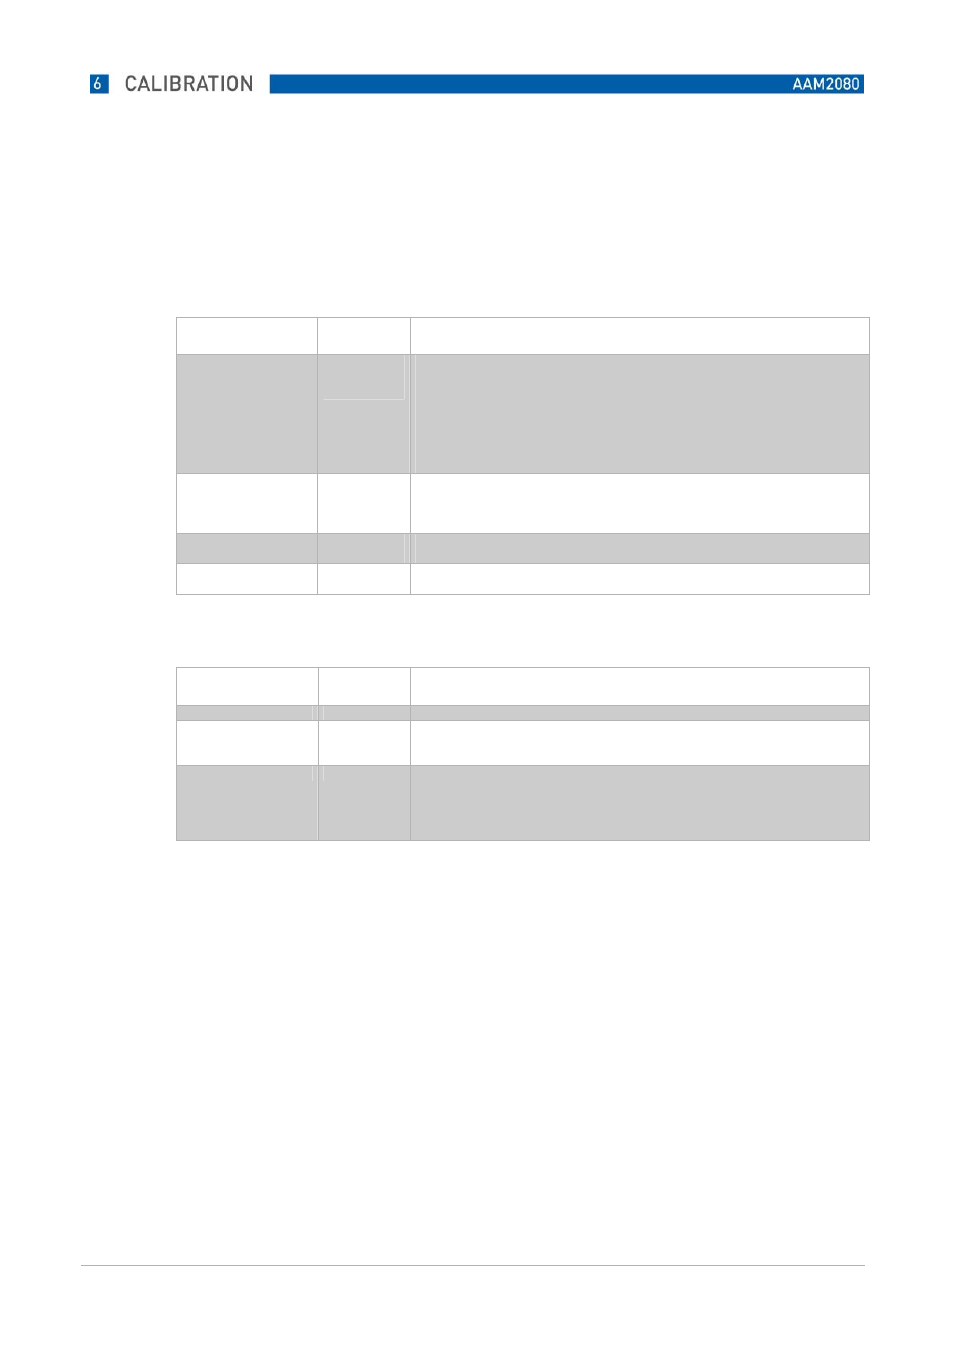
Hydrographs and data loggers
Designation
Settings
Description
Status curve
Yes
No
Yes
The measurement is shown additionally as a trend curve in the field beneath the
temperature display in the normal display screen of a measuring channel.
The display range corresponds to the set range of the mA power output.
No
Depiction of the hydrograph in the measuring channel display screen is switched off.
Number windows
00 – 03
Indicates the number of hydrograph windows (data logger function). A maximum of 3
windows can be activated.
Resolution
00.02 – 99.00
min.
Time interval during which the measurements are depicted in the status curve in
updated form.
Time range
00.1 – 99.9 h
Adjustable time for the visible time window of the status curve. Recommendation:
24.0 h
Calibration of analogue outputs
Designation
Settings
Description
Channel number
01 – 08
Selection of the channel in which the analogue output is to be tested / calibrated.
Simulation
00 – 20 mA
Entry of a power value which is then present at the corresponding terminals of the
respective channel.
Ideal for simple testing of signal lines from the converter to analogue value recorders.
Power value
00 – 20 mA
Entry of the power value actually arriving at the end of the signal line when a
simulated current value has been preset.
The converter automatically corrects the analogue output based on the entry.
This way you can easily compensate for signal deviations/losses of current in signal
lines.