2 printed monitoring task data – LumaSense Technologies INNOVA 1412i User Manual
Page 96
Chapter 8
______________________________________________________________________
_____________________________________________________________________________
BE6025-15
1412i Photoacoustic Gas Monitor
LumaSense Technologies A/S
Page 96 of 202
( )
N
C
C
N
n
n
n
TWA
å
=
=
=
1
= linear average of all the measurements made during
the averaging period.
Where:
Cn = constant concentration measured at time Tn;
N = the total number of measurements performed during
the averaging period T min.
In the situation where the total monitoring period is the same as the
averaging period then the averaged value of the last performed
measurement will be the same as the Mean Value (µ) shown on the
display screen (see
3
8.2 Printed Monitoring Task Data
illustrates how data from a monitoring task is displayed on
the Monitor’s screen. When monitoring task data appearing in Display
Memory is printed out, the same information appears but it is
presented in a different format. An example of a monitoring task
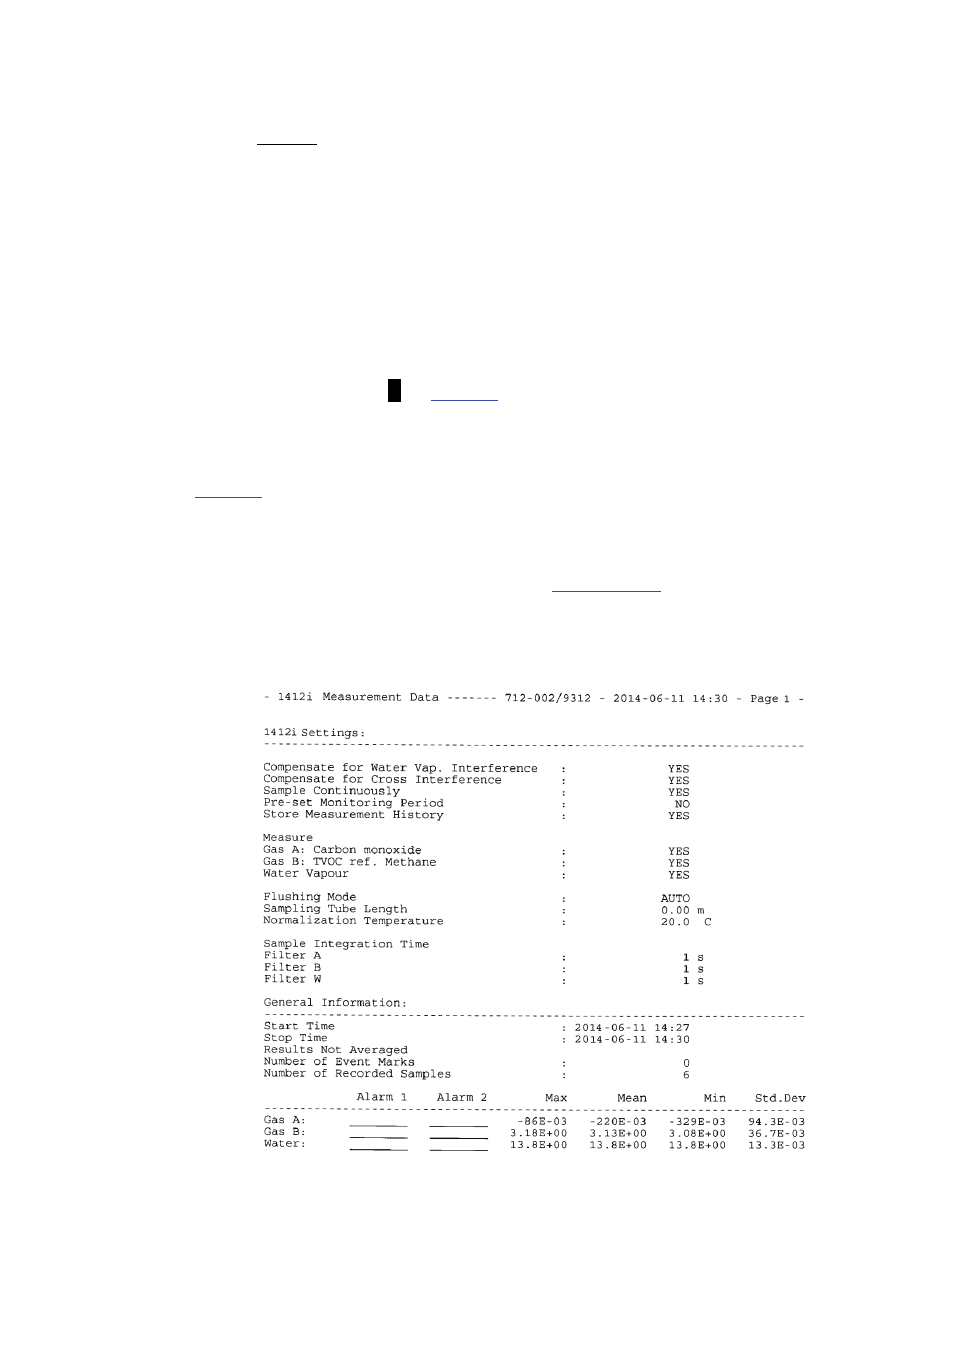
data print-out is shown in Fig.8.3 –
describes how this is
done.
Fig.8.3 Print-out of monitoring task data