1 spotting the trend: real world example – PreSonus StudioLive AI Series User Manual
Page 58
4
Universal Control-AI and VSL-AI
4.9
Smaart System Check Wizards
StudioLive
™
AI Software Library
Reference Manual
54
Music Playback/Reproduction
Subs
Speech Intelligibility
2 to 4 kHz
100 Hz
Power User Tip: The amplitudes depicted in the trend examples shown here are
guidelines: examples of very general slopes required for different applications.
The desired value will be different for every gig, and it is ultimately up to you to
decide what is required for your show, based on what type of artist is performing
and what kind of sound system you are using. While making a trace follow these
trends is recommended, in real-world applications, this might not always be
possible. Being able to compromise and work with what you have often requires
a certain amount of creativity and artistry on the part of the system engineer.
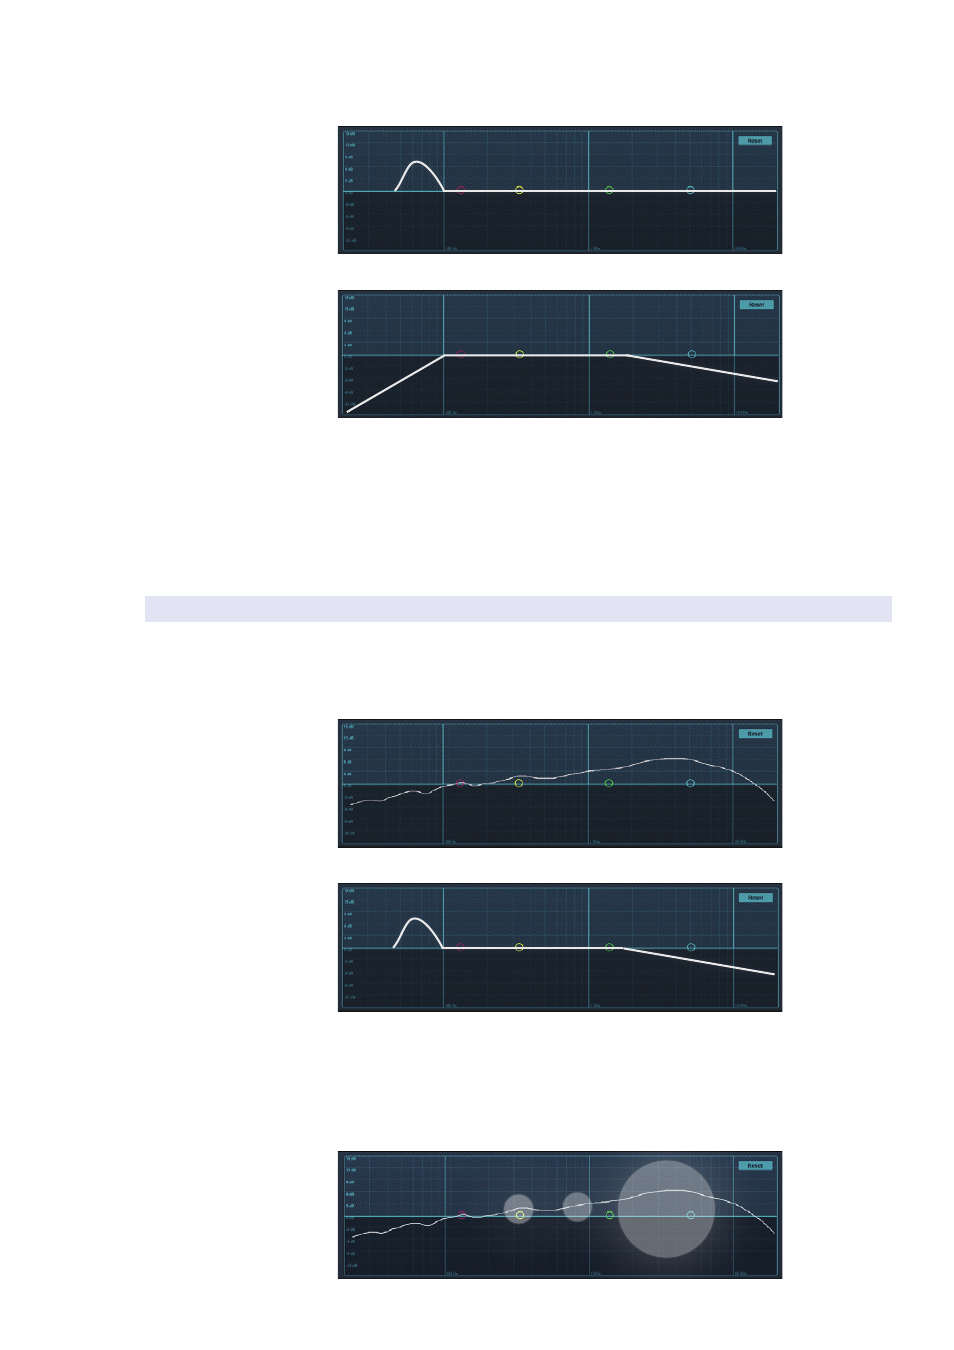
4.9.7.1 Spotting the Trend: Real World Example
Let’s take a look at the following frequency-response trace. In this
example we can see a few peaks that don’t go along with our
application; for our purposes, let’s make that a music concert.
Our goal is to get from this:
to this:
Subs
2 to 4 kHz
…all the while keeping in mind that we cannot alter the speaker’s
frequency-response curve, even if we would like to.
Looking at our trace, it’s easy to spot a few problem areas. There’s a
bump at 300 Hz that could be smoothed out a bit. Another bump
at 750 Hz could stand some flattening, and a big rise at 1 kHz to 10
kHz is going to make our system shrill at higher volumes.