L graphical display – TREND IQ3 User Guide User Manual
Page 14
14
IQ3 Web User Guide TC200631 Issue 2, 02/02/2009
IQ3 Pages
3.5
Graphical Display Pages
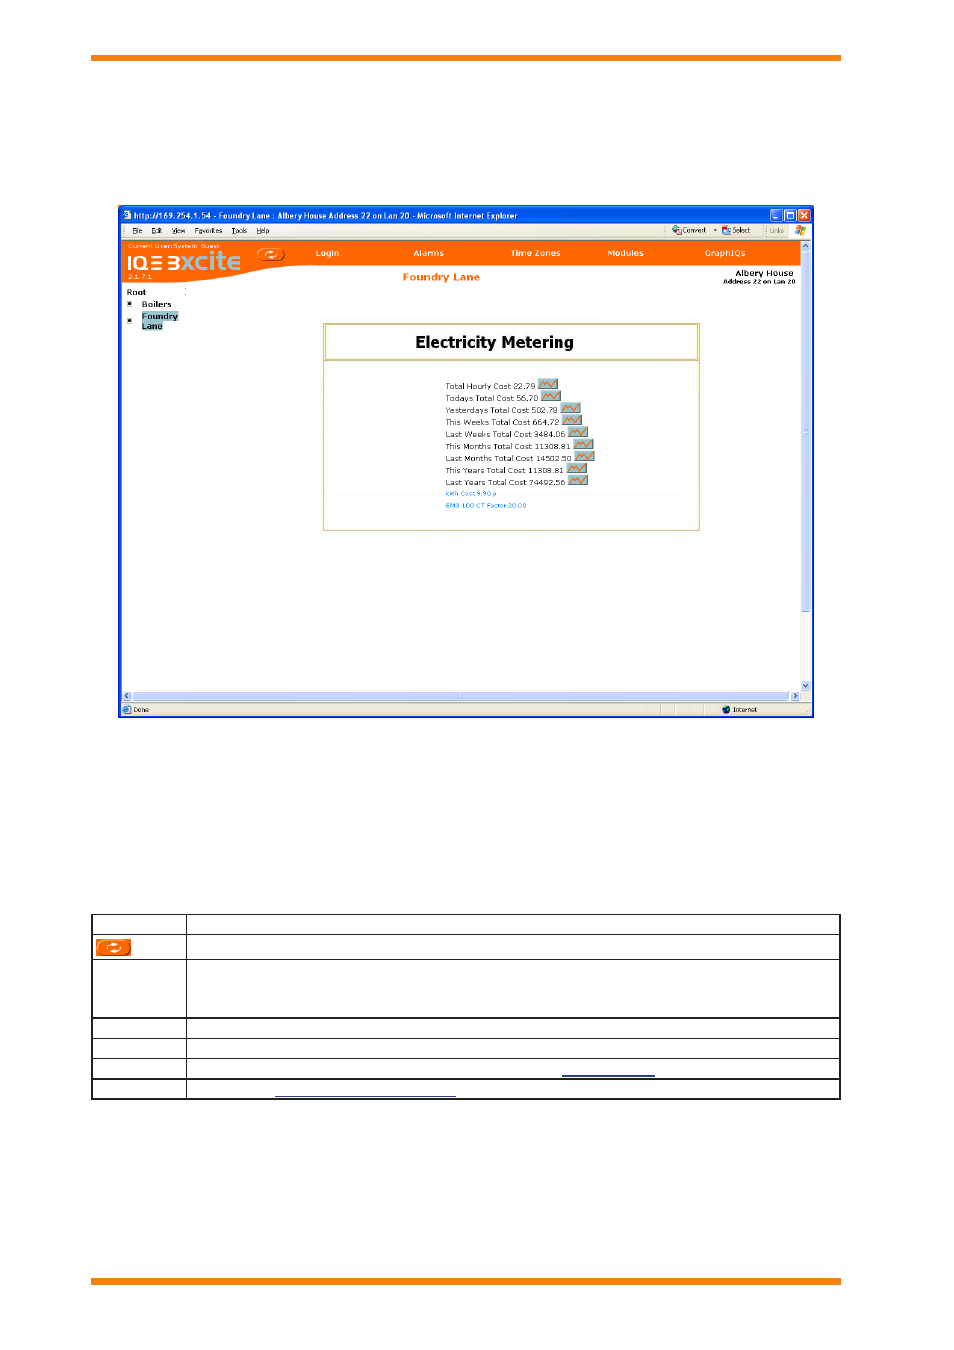
The graphical display Pages are accessed by clicking graphiQs, they may also be displayed when you login
depending on how your user has been configured. graphical display Pages provide a graphical way of viewing
information from the IQ3 controller, and making changes.
The graphical display pages are divided into three areas:
Menu Bar
Directory Tree
Data Area
Menu Bar
The menu bar provides access to other pages, and enables the data on the existing page to be refreshed. The table
below describes the function of each button.
Button
Description
Refreshes the data in the alarm list.
login/
logout
This button changes between login, and logout depending on whether you have entered a valid
user name and password. login enables the user name and password to be entered, and logout
enables you to logout when you finish
Alarms
Displays the Alarms page which lists modules in the controller’s alarm log.
time Zones Displays the time Zone overview page which contains a list of the time zone modules.
Modules
Displays the Modules page which provides access to the
graphiQs
Displays the
top level graphical display
page configured for the controller if one exists.
Directory Tree
The directory tree contains all the directory modules in the controller in a hierarchal structure. Selecting a directory
module causes the associated display modules to be displayed in the data area.
Data Area
The data area displays the graphical display pages for the directory module that has been selected in the directory
tree.
contains all the directory modules in the controller in a hierarchal structure.