Luminex IS Version 2.3 User Manual
Page 21
x
MAP Technology
Luminex 2.3 Software
PN 89-00002-00-110 Rev. B
11
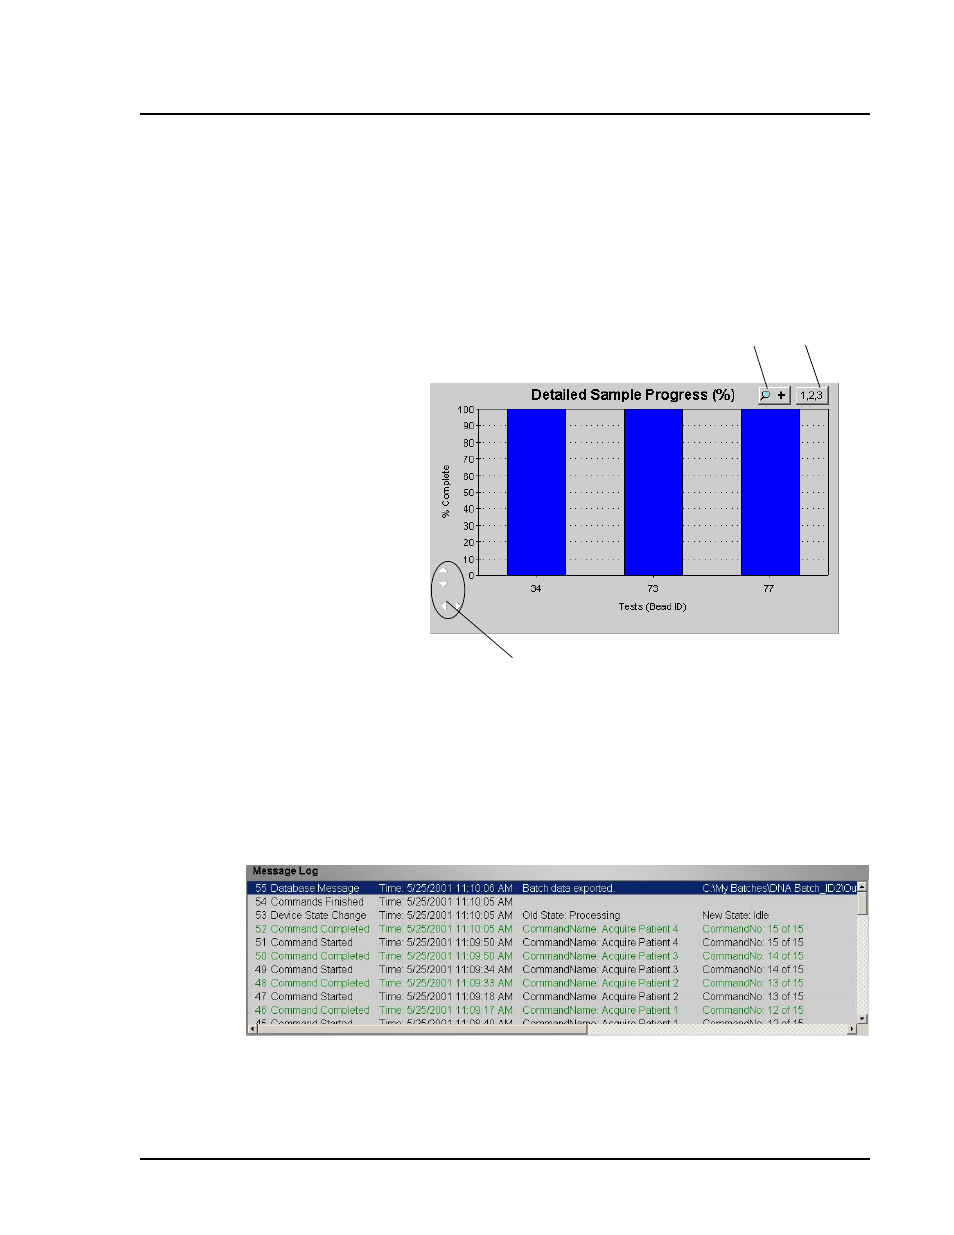
The Detailed Sample Progress section displays the percentage of
completion for each bead ID or test. The graph shows real-time
progress, so that as each sample is analyzed, the graph adjusts to
show progress. Use the zoom button to view up to 20 tests at a time.
Use the toggle button to view the bead ID or test name. Use the
Expand Margin (up/down and left/right) arrows to expand the chart
margins and view longer test names. See Figure 9.
.
1. Zoom button
2. Toggle button
3. Expand Margin arrows
Figure 9 Detailed Sample Progress
The Message Log is the lower pane on the Diagnostic tab. It displays
a list of completed commands, errors, and warnings. It also displays
command progress, time and date, and results. See Figure 10.
Figure 10 Message Log
The log displays actions in color-coded text and shading. Items in the
Message Log appear in the following color codes:
1
2
3